
2.3: Testing Economic Models & Analysis
- Page ID
- 11790

Let us now investigate the interplay between models and data by means of a couple of examples.
The first simple economic model we proposed related house prices and mortgage rates. That model argued that an important cause of the recently observed rise in house prices was the decline in mortgage interest rates. Figure 2.1 illustrated that relationship with a diagram and Equation 2.1 put the model in terms of basic algebra.
The logic of the model is based on the effects of the costs of financing on prices and specifically on house prices. Lower mortgage rates make financing house purchases more affordable and lower the income criteria that mortgage lenders apply to mortgage approvals. Potential buyers can afford higher priced houses and potential sellers may expect to get more for their properties. As a result, our model argues that lower mortgage rates push up house prices.
There is also an important policy issue here. On several occasions the federal government minister of finance has expresses concerns about low mortgage rates and long mortgage terms as a potential cause of a house price ‘bubble’. Experience with house price increases in other countries leading up to the financial crisis of 2008 provides a solid basis for this concern. As a result starting in 2008 and as recently as 2012 the federal government has taken action to discourage competitive reductions in mortgage rates, to limit the terms and amortization periods and to increase down payment requirements for new mortgage. The underlying rationale for these actions is the belief that higher mortgage rates, shorter terms and higher down payments will relieve upward pressure on house prices.
Let us now formalize the above ideas into an economic model of house prices. Several factors influence house prices and mortgage rates are one; another is the income of the potential buyers; a third is the number of houses or condominiums that come on the market – either new or not; a fourth could be the growth in population in the area where we are exploring house prices. If we think these are the main determinants of house prices then we could formalize this theory in the following model:
\(\text{House prices} = f(\text{mortgage rate, incomes, supply of housing offered on the market, population growth,...})\)
The notation \(f(...)\) means that the variable on the left-hand side of the equation is a function of the variables inside the parentheses. This equation is, therefore, an economic model that links behaviour to its main determinants.
Evidence
To support or reject the above models, we need to confront them with data. Unlike natural sciences, economics is a social science; therefore we rarely have data that come from laboratory experiments. Most of our research uses data collected over periods of time during which many relevant factors change simultaneously. A basic challenge in testing is how to disentangle the separate influences of these changing factors.
Table 2.4 contains data on the 5-year conventional mortgage interest rate and an index of resale housing prices, quarterly for the period from the first quarter of 2007 to the fourth quarter of 2011. The house price index has a base value of 100 in the last quarter of 2006, and reflects a weighted average of detached bungalows, executive and detached two-story houses. Figure 2.5 is a scatter diagram of the data in Table 2.4.
A Scatter diagram plots pairs of values simultaneously observed for two variables.
A clear negative relationship between the two variables is evident in Figure 2.5. A higher mortgage rate is associated with lower house prices.
Fitting lines through the scatter plot
A line through the scatter of points in Figure 2.5 shows the average relationship between mortgage rates and house prices. A challenge is to define the line that most accurately characterizes the relationship. This task is the job of econometricians, who practice econometrics. Econometrics is the science of examining and quantifying relationships between economic variables. It attempts to determine the separate influences of each variable, in an environment where many things move simultaneously.
Econometrics is the science of examining and quantifying relationships between economic variables.
Econometricians are individuals who study econometrics.
In two dimensions, the line drawn through the scatter is chosen to minimize the sum of distances (or distances squared) between the line and the various points. It is called a regression line or a trend line if the data are in time-series form. Computer algorithms that do this are plentiful, and fortunately computers can work in many dimensions in order to capture the influences of all the variables simultaneously1.
Regression line: representation of the average relationship between two variables in a scatter diagram.
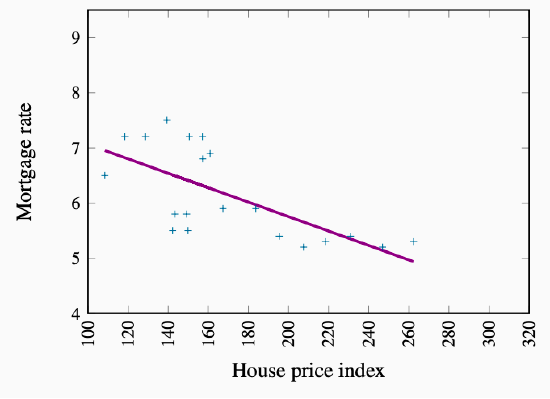
Figure 2.5: House Prices and the Mortgage Rate
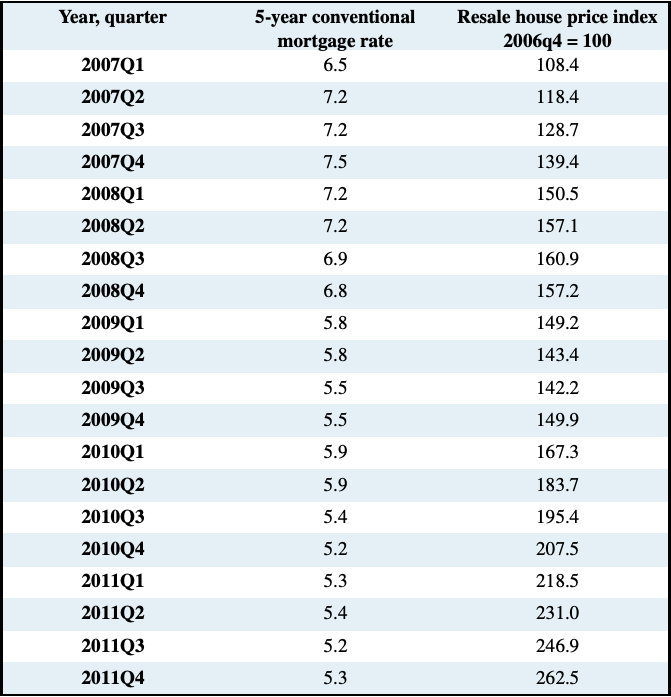
Table 2.4: Mortgage Rates and House Prices Canada 2007-2011
Source: Mortgage rate: Statistics Canada, CANSIM Series V122521; Re-
sale Housing Price index: www.royallepage.com, and authors’ calculations.
1Note in Figure 2.5 that the vertical axis begins at the value of 4, and the horizontal axis begins at a value of 100.