Let us turn, next, to a design with one nominal and one ordinal variable: a test of the second of the three hypotheses introduced at the beginning of this chapter. Again, it is restated here together with the background assumption from which it is derived:
(12) Assumption: Animate items occur before inanimate items.
Hypothesis: The S -POSSESSIVE will be used when the modifier is high in ANIMACY, the OF -POSSESSIVE will be used when the modifier is low in ANIMACY.
The constructions are operationalized as before. The data used are based on the same data set, except that cases with proper names are now included. For expository reasons, we are going to look at a ten-percent subsample of the full sample, giving us 22 s -possessives and 17 of -possessives.
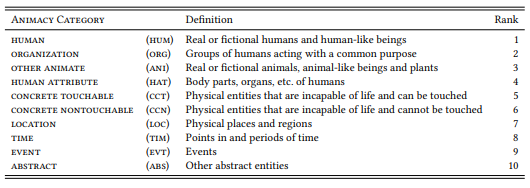
ANIMACY was operationally defined in terms of the annotation scheme shown in Table 5.5 (based on Zaenen et al. 2004).
As pointed out above, ANIMACY hierarchies are a classic example of ordinal data, as the categories can be ordered (although there may be some disagreement about the exact order), but we cannot say anything about the distance between one category and the next, and there is more than one conceptual dimension involved (I ordered them according to dimensions like “potential for life”, “touchability” and “conceptual independence”).
Table 5.5: A simple annotation scheme for ANIMACY
We can now formulate the following prediction:
(13) Prediction: The modifiers of the S -POSSESSIVE will tend to occur high on the ANIMACY scale, the modifiers of the OF -POSSESSIVE will tend to occur low on the ANIMACY scale.
Note that phrased like this, it is not yet a quantitative prediction, since “tend to” is not a mathematical concept. While frequency for nominal data and mean (or “average”) for cardinal data are used in everyday language with something close to their mathematical meaning, we do not have an everyday word for dealing with differences in ordinal data. We will return to this point presently, but first, let us look at the data impressionistically. Table 5.6 shows the annotated sample (cases are listed in the order in which they occurred in the corpus).
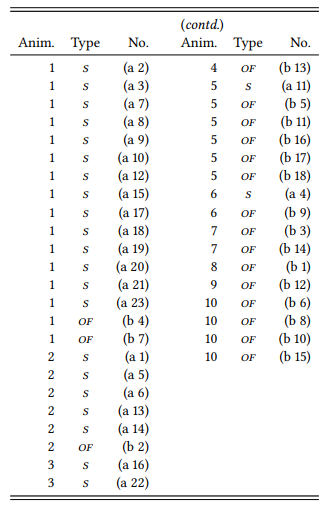
A simple way of finding out whether the data conform to our prediction would be to sort the entire data set by the rank assigned to the examples and check whether the s -possessives cluster near the top of the list and the of -possessives near the bottom. Table 5.7 shows this ranking.
Table 5.7 shows that the data conform to our hypothesis: among the cases whose modifiers have an animacy of rank 1 to 3, s -possessives dominate, among those with a modifier of rank 4 to 10, of -possessives make up an overwhelming majority.
However, we need a less impressionistic way of summarizing data sets coded as ordinal variables, since not all data set will be as straightforwardly interpretable as this one. So let us turn to the question of an appropriate descriptive statistic for ordinal data.
Table 5.6: A sample of s - and of -possessives annotated for ANIMACY (BROWN)
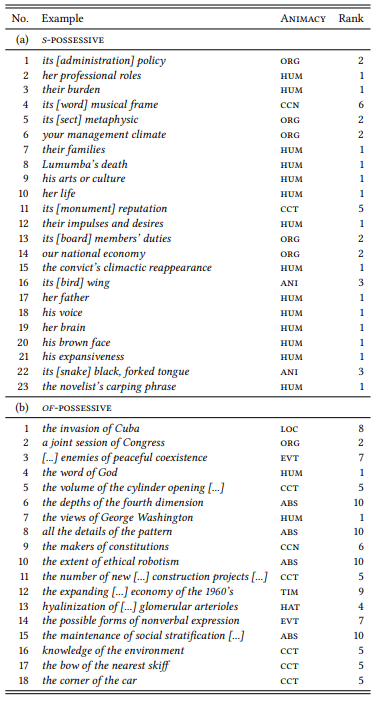
Table 5.7: The annotated sample from Table 5.6 ordered by animacy rank
5.3.1 Medians
As explained above, we cannot calculate a mean for a set of ordinal values, but we can do something similar. The idea behind calculating a mean value is, essentially, to provide a kind of mid-point around which a set of values is distributed – it is a so-called measure of central tendency. Thus, if we cannot calculate a mean, the next best thing is to simply list our data ordered from highest to lowest and find the value in the middle of that list. This value is known as the median – a value that splits a sample or population into a higher and a lower portion of equal sizes.
For example, the rank values for the Animacy of our sample of s -possessives are shown in Figure 5.1a. There are 23 values, thus the median is the twelfth value in the series (marked by a dot labeled M) – there are 11 values above it and eleven below it. The twelfth values in the series is a 1, so the median value of s-possessive modifiers in our sample is 1 (or HUMAN).
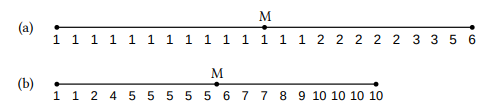
Figure 5.1: Medians for (a) the s -possessives and (b) the of -possessives in Table 5.7
If the sample consists of an even number of data points, we simply calculate the mean between the two values that lie in the middle of the ordered data set. For example, the rank values for the Animacy of our sample of of -possessives are shown in Figure 5.1b. There are 18 values, so the median falls between the ninth and the tenth value (marked again by a dot labeled M). The ninth and tenth value are 5 and 6 respectively, so the median for the of -possessive modifiers is (5+6)/2 = 5.5 (i.e., it falls between CONCRETE TOUCHABLE and CONCRETE UNTOUCHABLE).
Using the idea of a median, we can now rephrase our prediction in quantitative terms:
(14) Prediction: The modifiers of the S -POSSESSIVE will have a higher median on the Animacy scale than the modifiers of the OF -POSSESSIVE.
Our data conform to this prediction, as 1 is higher on the scale than 5.5. As before, this does not prove or disprove anything, as, again, we would expect some random variation. Again, we will return to this issue in Chapter 6.
5.3.2 Frequency lists and mode
Recall that I mentioned above the possibility of treating ordinal data like nominal data. Table 5.8 shows the relative frequencies for each animacy category, (alternatively, we could also calculate expected frequencies in the way described in Section 5.3 above).
Table 5.8: Relative frequencies for the Animacy values of possessive modifiers
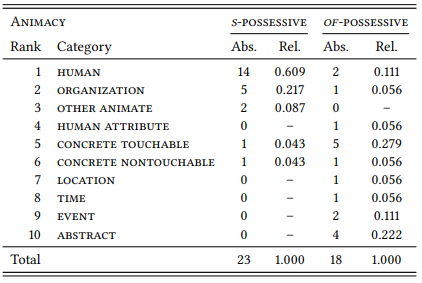
This table also nicely shows the preference of the s-possessive for animate modifiers (human, organization, other animate) and the preference of the of - possessive for the categories lower on the hierarchy. The table also shows, however, that the modifiers of the of -possessive are much more evenly distributed across the entire ANIMACY scale than those of the s -possessive.
For completeness’ sake, let me point out that there is a third measure of central tendency, that is especially suited to nominal data (but can also be applied to ordinal and cardinal data): the mode. The mode is simply the most frequent value in a sample, so the modifiers of the of -possessive have a mode of 5 (or CONCRETE TOUCHABLE) and those of the s -possessive have a mode of 1 (or human) with respect to animacy (similarly, we could have said that the mode of s -possessive modifiers is DISCOURSE-OLD and the mode of of -possessive modifiers is DISCOURSE-NEW). There may be more than one mode in a given sample.
For example, if we had found just a single additional modifier of the type ABSTRACT in the sample above (which could easily have happened), its frequency would also be five; in this case, the of -possessive modifier would have two modes (ONCRETE TOUCHABLE and ABSTRACT).
The concept of mode may seem useful in cases where we are looking for a single value by which to characterize a set of nominal data, but on closer inspection it turns out that it does not actually tell us very much: it tells us what the most frequent value is, but it does not tell us how much more frequent that value is than the next most frequent one, how many other values occur in the data at all, etc. Thus, it is always preferable to report the frequencies of all values, and, in fact, I have never come across a corpus-linguistic study reporting modes.

