
17.2: Biological Basis of Mood Disorders- Major Depressive and Bipolar Disorders
- Page ID
- 130119
This page is a draft and under active development. Please forward any questions, comments, and/or feedback to the ASCCC OERI (oeri@asccc.org).
- Describe what is meant by the term “mood disorder”.
- Describe the differences between depressive and bipolar disorders.
- Identify the biology thought to underlie the etiology of Major Depressive Disorder.
- Identify the biology thought to underlie the etiology of Bipolar Disorder (I & II).
Chapter Overview
Mood disorders are a broad category of psychological disorders characterized by severe disturbances in mood and emotion. While these disorders share common features of extreme mood alteration, most research suggests that they have different biological origins (Cuellar et al., 2005).
An Introduction to Mood Disorders
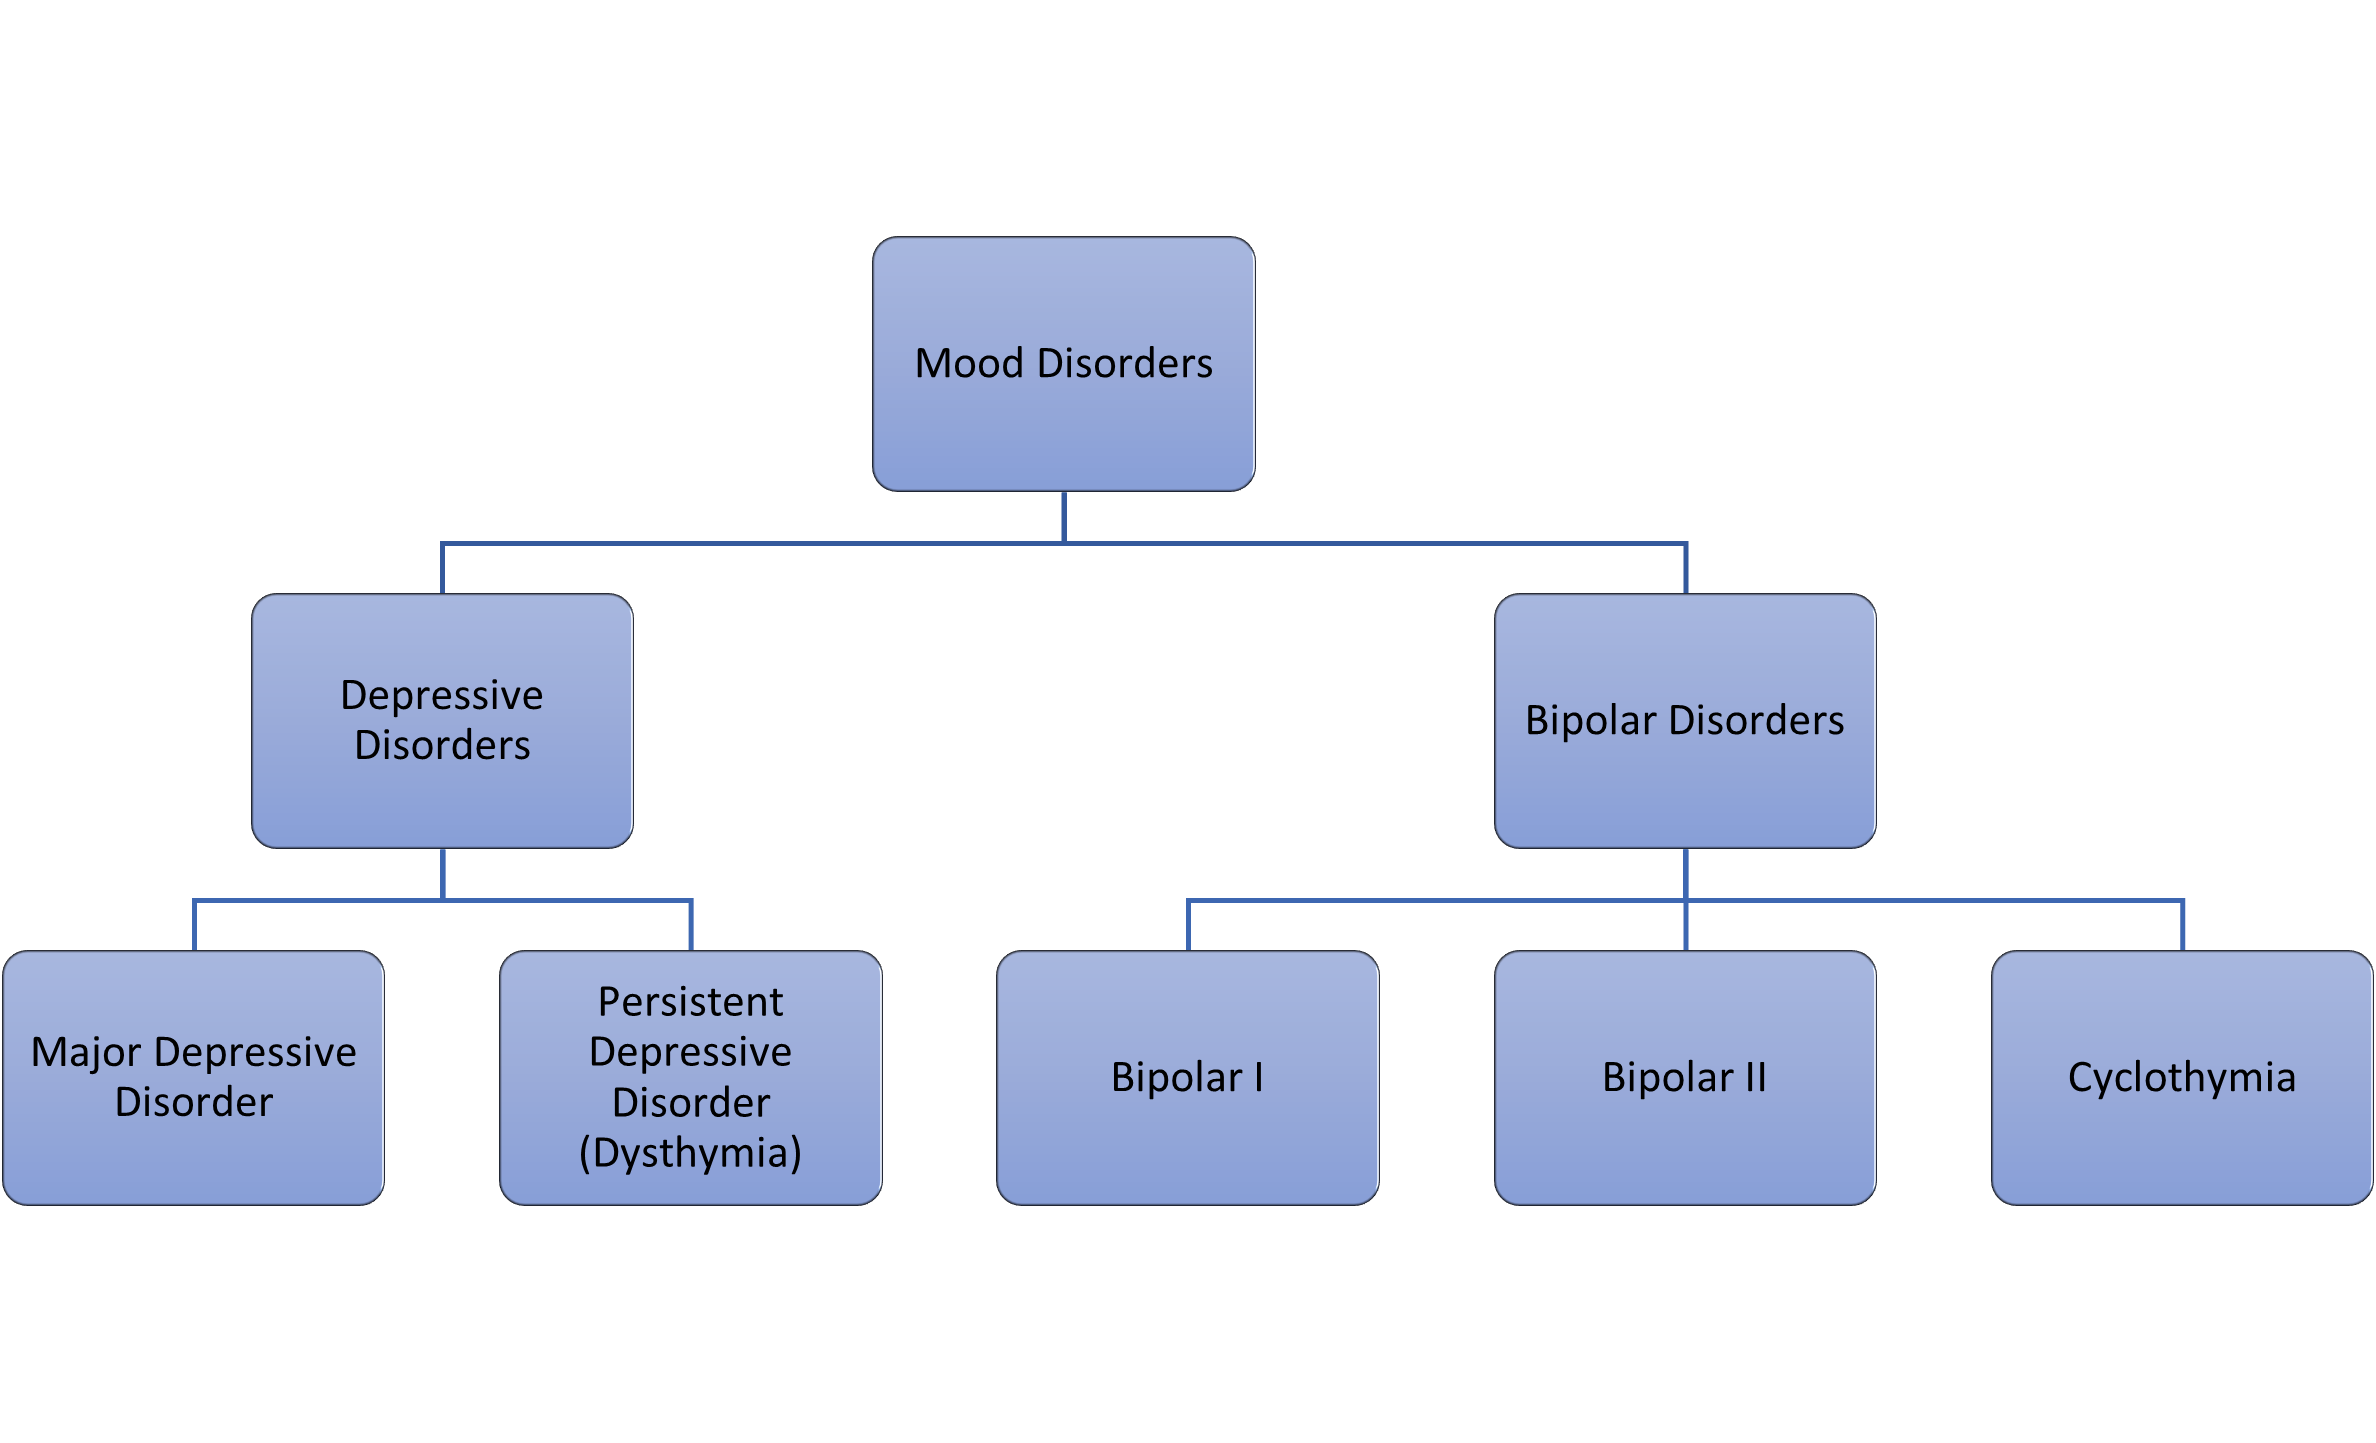
The classification, mood disorders, is used by mental health professionals to describe a broad group of psychological disorders characterized by severe disturbances in mood and emotion. Also known as affective disorders, disorders in this category are typically classified into two distinct groups: depressive disorders and bipolar disorders (Figure 17.2.1.).
Depressive disorders typically include major depressive disorder, also known as clinical depression, which is characterized by episodes of profound sadness and loss of interest or pleasure in usual activities, among other features, and persistent depressive disorder (formerly dysthymia), a milder but long-term, chronic form of depression. Bipolar disorders are characterized by mood states that vacillate between sadness and euphoria and include bipolar disorder types I and II, as well as cyclothymic disorder (APA, 2013).
Depressive Disorders
Depressive disorders are a group of disorders whose main features include a depressed mood for most of the day and/or feelings of anhedonia (the inability to feel pleasure from activities usual found enjoyable) (Post & Warden, 2018).
The DSM-5 describes the main features of depressive disorders as “the presence of sad, empty, or irritable mood, accompanied by somatic and cognitive changes that significantly affect the individual’s capacity to function.” (APA, 2013) Depressed people often report feeling sad, discouraged, and hopeless (Figure 17.2.2) These individuals lose interest in activities they once enjoyed, and often experience a decrease in drives such as hunger and sex, and frequently doubt their personal worth. When these features are triggered by a traumatic or negative experience (e.g. death of close loved one), it is called reactive depression. When there is no apparent reason or cause, it is known as endogenous depression.

Depressive disorders are often highly comorbid (meaning more than one health condition is present in the same person at the same time) with other psychological disorders. Depressive disorders are often seen occurring alongside anxiety disorders, bipolar disorders, and OCD and related disorders (Groen, et al., 2020).
Perhaps the most well-known example of a depressive disorder is Major Depressive Disorder (MDD), also known as clinical depression. Major depressive disorder is believed to affect about 2-5% of the global population each year (Han, et al., 2019). According to the DSM-5, the defining symptoms of major depressive disorder include “depressed mood most of the day, nearly every day” (feeling sad, empty, hopeless, or appearing tearful to others) and loss of interest and pleasure in usual activities (APA, 2013). When these symptoms last for longer than 2 weeks, and significantly impair an individual’s ability to function, that individual is said to be suffering from MDD.
Researchers and mental health professionals both agree that there is no single cause responsible for any of the depressive disorders. Rather it is thought that depressive disorders arise from the interaction between multiple biological and environmental factors. However, this interaction is thought to be extremely complex and is still not well understood. As such, the biology underlying depressive disorders continues to be a major subject of ongoing research and is explored in more detail below.
The Genetics and Epigenetics of Depressive Disorders
Historically, evidence from family, twin, and adoption studies has seemed to support the idea that genetic factors play an important role in the development of depressive disorders, although which genes are involved and the how these genes interact to contribute to the development of depressive disorders is still not understood (Lohoff, 2010).
In 2015, several genome-wide association studies (GWASs), which involve scanning the genomes of large groups of people to find genetic variations associated with a disorder, identified over 100 possible genes which may play a role in increasing an individual’s risk for developing a depressive disorder (Ormel, et al., 2019, Shadrina, et al., 2018).
As a result of these studies, and others, it is now believed that an individual’s genetic predisposition to a depressive disorder is determined by (1) the coordinated action of many genes, (2) the genes’ interactions with each other, and (3) their interactions with environmental factors through epigenetic mechanisms (Shardina, et al., 2018).
Current research is now focusing on the role of epigenetics - how behaviors and environment can cause changes that affect the way our genes work, in the development of depressive disorders such as MDD (Barbu, et al., 2020).
To learn more about the interaction of biology and environment in the development of depressive disorders, check out this video lecture provided by Stanford Univeristy professor, Dr. Robert Sapolsky:
The Role of Neurotransmitters in Depressive Disorders
Until relatively recently, low levels of neurotransmitters in the brain were believed to be the main culprits behind depressive disorders. However, current research now suggests that, while neurotransmitters do play an important role, the reality is much more complicated than previously thought.
Monoamine Theory of Depression
It has historically been believed that low activity levels of monoamine neurotransmitters (norepinephrine, serotonin, and dopamine) contribute to the symptoms associated with depressive disorders (Nutt, 2008). The discovery that certain drugs which increased levels of serotonin and norepinephrine in the brain, alleviated depressive symptoms, lead to formulation of the monoamine theory of depression by Joseph Schildkraut in the 1960s. According to the monoamine theory, low levels of serotonin, norepinephrine, and/or dopamine in the central nervous system are primarily the basis for the development of depressive disorders (Hirschfeld, 2000). This theory prevailed for more than 50 years before being challenged by an increasing number of research studies and clinical observations.
Today, most current research acknowledges that while monoamine neurotransmitters are important, they are by far not the only neurotransmitters involved in depressive disorders. The following video from Yale Medicine explains why the monoamine theory of depression is no longer believed to be correct and what alternative theories researchers are currently exploring. For example, other neurotransmitters, such as glutamate and GABA, are increasingly being investigated for their role in the development of depression.
Furthermore, research is increasingly focused not only on individual neurotransmitters, but also on the interactions between the various neurotransmitters themselves as well as how they interact with other biological systems such as the endocrine system (Ding et al., 2014). For example, serotonin production and activity are affected by the hormones secreted by the endocrine system, such as cortisol, in response to threat or stress.
The role of neural structures in MDD
Research into the neural basis of MDD has focused on examining the neural architecture of individuals with MDD by using a variety of both structural and functional neuroimaging techniques. Structural techniques, such as CT scans and magnetic resonance imaging (MRI), take static pictures of the brain to determine whether any specific neural structures are different in subjects with MDD than control subjects.
By using these static neuroimaging techniques, researchers have discovered several areas of the brain where the volume of grey matter is significantly decreased in those individuals with MDD (Filatova, et al., 2021). These areas include the prefrontal cortex (PFC), hippocampus, amygdala, and cingulate cortex (Ancelin, et al. 2019).
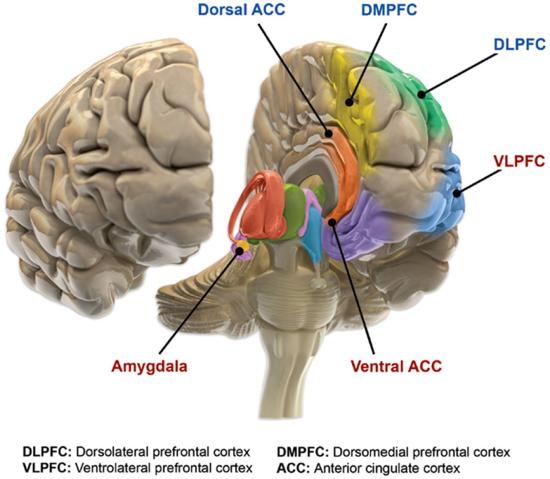
Importantly, these areas comprise most of the major structures in the brain’s corticolimbic system, a system responsible for regulating multiple behavioral and cognitive functions, including decision making, motivation, emotional processing, and our response to stress and pain (Vachon-Presseau, 2018) (Figure 16.2.3.).
.png?revision=1&size=bestfit&width=527&height=398)
In addition to looking at the overall structure of the brain, researchers also use functional neuroimaging techniques, such as positron emission tomography (PET) scans and functional magnetic resonance imaging (fMRI), to examine the brain in action, looking for any areas of atypical activation.
For example, a meta-analysis of neuroimaging studies showed that when viewing negative stimuli (e.g., picture of an angry face, picture of a car accident), participants with MDD have greater activation in brain regions involved in stress response, such as the amygdala and anterior cingulate cortex, and reduced activation in brain regions involved in positively motivated behaviors, such as the prefrontal cortex, compared with healthy control participants. (Hamilton, et al., 2012).
Other functional imaging studies have examined alterations in the functional connectivity - the strength of the connections between regions of the brain. These connections allow multiple brain regions to properly “talk” to one another; that is to perceive, generate, and encode information in concert. By examining these neural connections, researchers can see if there are problems in the way the brain processes specific types of information in individuals with MDD, and where these “faulty” connections may occur (Goldstein-Peikarski, et al. 2018).
Several studies have noted differences in the neural networks of individuals with MDD, compared to those without. For example, abnormally low activity in brain regions related to stopping thoughts and shifting to new ones, referred to in the research as “cognitive control,” and hyperactivity in other brain regions that “process emotional thoughts and feelings” has consistently been found in individuals with MDD (Janiri, et al., 2019).
Bipolar Disorders
Some people who suffer from clinical depression may also experience what are known as manic or hypomanic episodes. When this occurs, the individual is usually diagnosed with bipolar disorder.
Hypomanic episodes are fairly short– around 4 days in duration, and are characterized by a positive mood, reduced need for sleep, and high energy. Individuals experiencing a hypomanic episode are often talkative, impulsive, energetic, and very confident. It is important to note that by definition, hypomanic episodes cannot cause impairment, distress, or the need for hospitalization. If any of these three features are present the episode is considered to be manic, rather than hypomanic.
Manic episodes are longer, at least 1 week in duration, and have features similar to hypomania but taken to an extreme. In addition, manic episodes are often characterized by delusions of grandeur, psychosis, and distractibility. Additionally, for an episode to be considered manic, it must cause impairment in functioning, significant distress, or require the individual to be hospitalized.
Bipolar I disorder, previously known as manic-depressive disorder, is diagnosed when there is at least one manic episode. This manic episode may be preceded by or followed by a major depressive episode but that is not required for the Bipolar I diagnosis. In contrast, a diagnosis of bipolar II disorder is made when the individual has experienced both a hypomanic episode and a depressive episode, but no manic episodes. Alternatively, an individual may suffer from cyclothymic disorder, which characterized by multiple, alternating periods of hypomania and depression, lasting at least two years. To qualify for cyclothymic disorder, the person must experience symptoms at least half the time with no more than two consecutive symptom-free months; and the symptoms must cause significant distress or impairment (APA, 2013).
The Genetics and Epigenetics of Bipolar Disorders
Numerous twin and family studies have shown that there is a strong genetic component to bipolar disorders, especially Bipolar I (Edvardsen et al., 2008, Escamilla & Zavala, 2008). However, the exact nature of this genetic component remains elusive – numerous studies, include a genome-wide association study (GWAS) of more than 40,000 bipolar disorder cases, have identified hundreds to thousands of genes associated with bipolar disorder (Gandal, et al. 2018).
Given the complicated genetic component, recent research has focused on the identifying epigenetic mechanisms which may play role in the risk and development of bipolar disorders (Duffy, et al. 2019).
Genome-wide association studies, or GWAS, have become an increasingly popular tool for exploring the genetic and epigenetic factors involved in psychological disorders, such as Biopolar Disorders. To learn more about GWAS and their use in Bipolar disorder research, check out the following video:
The Role of Neurotransmitters and Neural Structures in Bipolar Disorders
As depression was often a characteristic of bipolar disorders, researchers initially believed that norepinephrine, serotonin, and dopamine were all implicated in the development of bipolar disorder. It was thought that manic episodes were the result of drastic increases in serotonin. Unfortunately, research did not support this hypothesis. It is now believed that manic episodes may, in fact, be explained by low levels of serotonin and high levels of norepinephrine (Soreff & McInnes, 2014).
In addition, consistent decreases in gray matter volume in both the prefrontal cortex and areas of the limbic system, such as the hippocampus, have been reported, as have enlargement of the ventricles (Jiang, et al. 2020).
Studies of brain activity have led to the view that bipolar disorder may be a suite of related neurological issues with interconnected functional abnormalities that often appear early in life and worsen over time. In support of this hypothesis, fMRI techniques have noted atypical activation of the frontal cortex and basil ganglia, as well as disruption in the connectivity between these structures (Maletic & Rasion, 2014). The issues in connectivity seem to cluster around those networks in the brain associated with emotional processing.
References
Ancelin, M. L., Carrière, I., Artero, S., Maller, J., Meslin, C., Ritchie, K., Ryan, J., & Chaudieu, I. (2019). Lifetime major depression and grey-matter volume. Journal of psychiatry & neuroscience, JPN, 44(1), 45–53. https://doi.org/10.1503/jpn.180026
Cuellar, A. K., Johnson, S. L., & Winters, R. (2005). Distinctions between bipolar and unipolar depression. Clinical psychology review, 25(3), 307–339. https://doi.org/10.1016/j.cpr.2004.12.002
Duffy, A., Goodday, S.M., Keown-Stoneman, C. et al. (2019). Epigenetic markers in inflammation-related genes associated with mood disorder: a cross-sectional and longitudinal study in high-risk offspring of bipolar parents. Int J Bipolar Disord 7(17). https://doi.org/10.1186/s40345-019-0152-1
Escamilla, M. A., & Zavala, J. M. (2008). Genetics of bipolar disorder. Dialogues in clinical neuroscience, 10(2), 141–152. https://doi.org/10.31887/DCNS.2008.10.2/maescamilla
Filatova, E. V., Shadrina, M. I., & Slominsky, P. A. (2021). Major Depression: One Brain, One Disease, One Set of Intertwined Processes. Cells, 10(6), 1283. https://doi.org/10.3390/cells10061283
Goldstein-Piekarski, A.N., Staveland, B.R., Ball, T.M. et al. Intrinsic functional connectivity predicts remission on antidepressants: a randomized controlled trial to identify clinically applicable imaging biomarkers. Transl. Psychiatry 8, 57 (2018). https://doi.org/10.1038/s41398-018-0100-3
Groen, RN, Ryan, O., Wigman, JTW., Harriëtte R., Brenda, WJH, Penninx, EJ, Giltay, MW, & Hartman, CA (2020). Comorbidity between depression and anxiety: assessing the role of bridge mental states in dynamic psychological networks. BMC Med, 18(308). https://doi.org/10.1186/s12916-020-01738-z
Hamilton JP, Etkin A, Furman DJ, Lemus MG, Johnson RF, Gotlib IH. (2012). Functional neuroimaging of major depressive disorder: a meta-analysis and new integration of base line activation and neural response data. Am J Psychiatry, 169(7), 693-703. doi: 10.1176/appi.ajp.2012.11071105. PMID: 22535198.
Han, MH, Russo, SJ, & Nestler, EJ (2019). Molecular, Cellular, and Circuit Basis of Depression Susceptibility and Resilience. In Neurobiology of Depression (pp. 123-136). Academic Press. https://doi.org/10.1016/B978-0-12-813333-0.00012-3.
Hirschfeld, R. (2000). History and evolution of the monoamine hypothesis of depression. The Journal of Clinical Psychiatry, 61(6), 4-6.
Janiri D, Moser DA, Doucet GE, et al. Shared Neural Phenotypes for Mood and Anxiety Disorders: A Meta-analysis of 226 Task-Related Functional Imaging Studies. JAMA Psychiatry. 2020;77(2):172–179. doi:10.1001/jamapsychiatry.2019.3351
Jiang, W., Andreassen, O. A., Agartz, I., Lagerberg, T. V., Westlye, L. T., Calhoun, V. D., & Turner, J. A. (2020). Distinct structural brain circuits indicate mood and apathy profiles in bipolar disorder. NeuroImage. Clinical, 26, 101989. https://doi.org/10.1016/j.nicl.2019.101989
Lohoff F. W. (2010). Overview of the genetics of major depressive disorder. Current psychiatry reports, 12(6), 539–546. https://doi.org/10.1007/s11920-010-0150-6
Maletic V & Raison C. (2014) Integrated neurobiology of bipolar disorder. Front Psychiatry. 5(98). doi: 10.3389/fpsyt.2014.00098. PMID: 25202283; PMCID: PMC4142322.
Nutt DJ. (2008). Relationship of neurotransmitters to the symptoms of major depressive disorder. J Clin Psychiatry, 69(Suppl E1), 4-7.
Ormel J, Hartman CA, Snieder H. (2019). The genetics of depression: successful genome-wide association studies introduce new challenges. Transl Psychiatry. 9(1), 114. doi: 10.1038/s41398-019-0450-5. PMID: 30877272; PMCID: PMC6420566.
Post, RJ & Waren, MR (2018). Melancholy, Anhedonia, Apathy: The search for separable behaviors and neural circuits in depression. Current Opinions in Neurobiology, 49, 192-200.
Shadrina, M., Bondarenko, E. A., & Slominsky, P. A. (2018). Genetics Factors in Major Depression Disease. Frontiers in psychiatry, 9, 334. https://doi.org/10.3389/fpsyt.2018.00334
Vachon-Presseau, E. (2018) Effects of stress on the corticolimbic system: implications for chronic pain. Progress in Neuro-Psychopharmacology and Biological Psychiatry, 87(Part B), 216-223.
Attributions
Chapter 17, Biological Basis of Psychological Disorders, 17.2. Biological Bases of Mood Disorders original material written by Amy E. Coren, PhD, Pasadena City College, is licensed under CC BY-NC-SA 4.0. Some text of sections 17.2.3 and 17.2.4 adapted and modified by Amy E. Coren, Ph.D., Pasadena City College, from 6.1 Depressive Disorders Etiology & 6.2 Bipolar Disorders Etiology in Essentials of Abnormal Psychology by Alexis Bridley & Lee W. Daffin Jr., Washington State University; licensed under CC-BY-NC-SA 4.0 International License. Retrieved from: https://opentext.wsu.edu/abnormalpsy...g-information/
Fig. 17.2.1 Original creation by author, Amy E. Coren, Ph.D.
Fig. 17.2.2 Photo by Jack Lucas Smith on Unsplash
Fig. 17.2.3. Benes 2010, CC BY-SA 4.0 <https://creativecommons.org/licenses/by-sa/4.0>, via Wikimedia Commons CC BY 4.0
Fig. 17.2.4 Maletic V, Raison C, CC BY 4.0 <https://creativecommons.org/licenses/by/4.0>, via Wikimedia Commons CC BY 4.0