Social Sci LibreTexts

2.3: Growth in Body Length/Height

  • Page ID
    139028
    • Todd LaMarr
    \( \newcommand{\vecs}[1]{\overset { \scriptstyle \rightharpoonup} {\mathbf{#1}} } \) \( \newcommand{\vecd}[1]{\overset{-\!-\!\rightharpoonup}{\vphantom{a}\smash {#1}}} \)\(\newcommand{\id}{\mathrm{id}}\) \( \newcommand{\Span}{\mathrm{span}}\) \( \newcommand{\kernel}{\mathrm{null}\,}\) \( \newcommand{\range}{\mathrm{range}\,}\) \( \newcommand{\RealPart}{\mathrm{Re}}\) \( \newcommand{\ImaginaryPart}{\mathrm{Im}}\) \( \newcommand{\Argument}{\mathrm{Arg}}\) \( \newcommand{\norm}[1]{\| #1 \|}\) \( \newcommand{\inner}[2]{\langle #1, #2 \rangle}\) \( \newcommand{\Span}{\mathrm{span}}\) \(\newcommand{\id}{\mathrm{id}}\) \( \newcommand{\Span}{\mathrm{span}}\) \( \newcommand{\kernel}{\mathrm{null}\,}\) \( \newcommand{\range}{\mathrm{range}\,}\) \( \newcommand{\RealPart}{\mathrm{Re}}\) \( \newcommand{\ImaginaryPart}{\mathrm{Im}}\) \( \newcommand{\Argument}{\mathrm{Arg}}\) \( \newcommand{\norm}[1]{\| #1 \|}\) \( \newcommand{\inner}[2]{\langle #1, #2 \rangle}\) \( \newcommand{\Span}{\mathrm{span}}\)\(\newcommand{\AA}{\unicode[.8,0]{x212B}}\)

    Growth in Body, Length, and Height

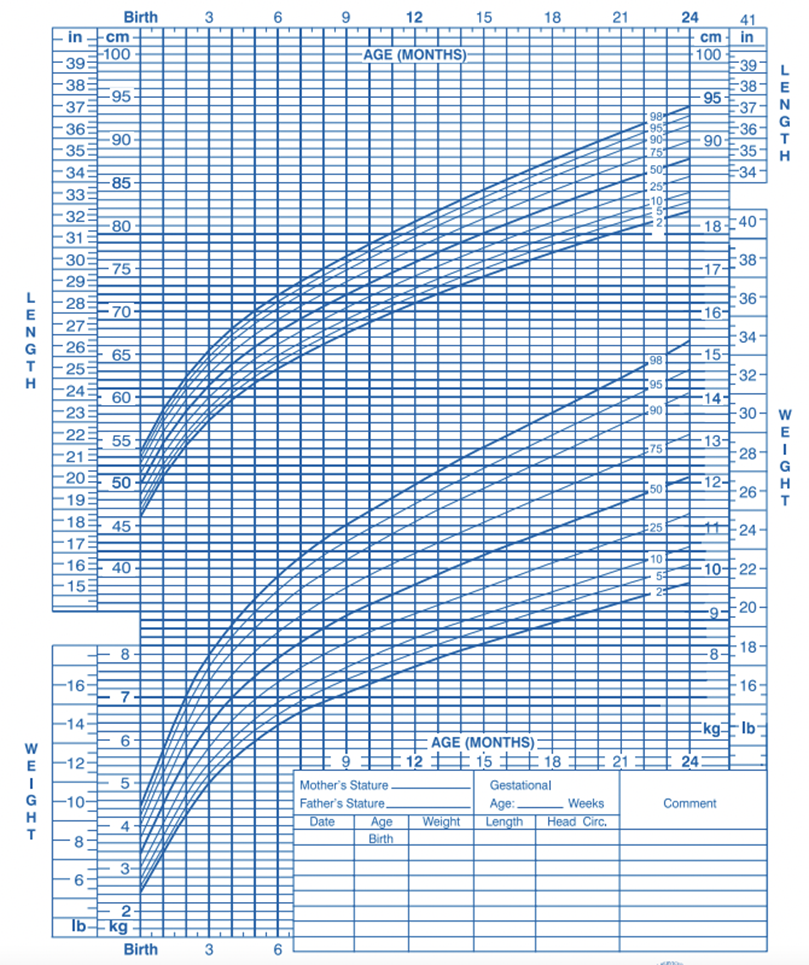
    The average length of a newborn is 19.5 inches, increasing to 29.5 inches by 12 months and 34.4 inches by 2 years old (WHO Multicentre Growth Reference Study Group, 2006). The average length at 12 months (one-year-old) typically ranges from 28.5 to 30.5 inches. The average length at 24 months (two years old) is around 33.2 to 35.4 inches (CDC, 2010). Figure \(\PageIndex{1}\) shows this rapid growth in length/height for males from birth through 24 months of age.

    This growth chart illustrates the data just discussed.
    Figure \(\PageIndex{1}\): Length and weight percentiles for boys 0 to 24 months. See Data Table of Infant Length-for-age Charts for a full breakdown of chart numbers [1]

    Stunted Growth

    Infant and toddler length/height can vary, but a length/height too low can be a worrisome sign of stunted growth. Stunted growth is characterized by a height of more than two standard deviations below the World Health Organization (WHO) age-specific growth reference standard (WHO Multicentre Growth Reference Study Group, 2007). In simpler terms, stunted growth is when children are significantly shorter in length/height than what would be expected for their age. Children with stunted growth have a mortality rate that is three times higher than their peers (McDonald et al., 2013; Victora et al., 2021) and are at a higher risk of displaying cognitive challenges later in life (Prendergast & Humphrey, 2014; Sanou et al., 2018; Walker et al., 2021).

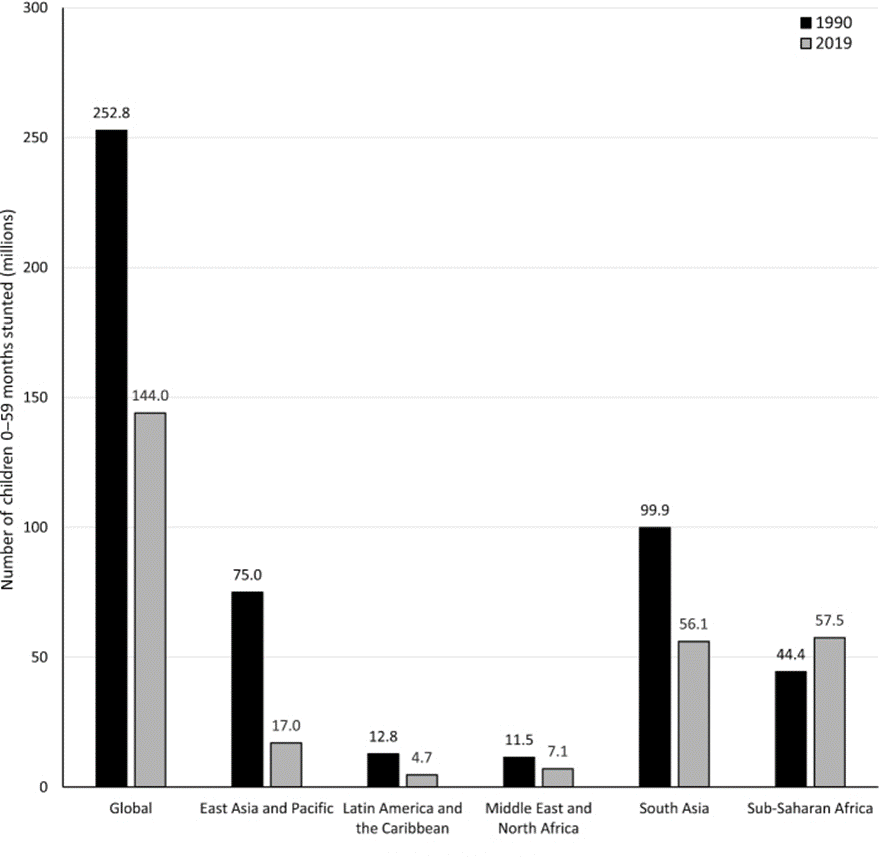
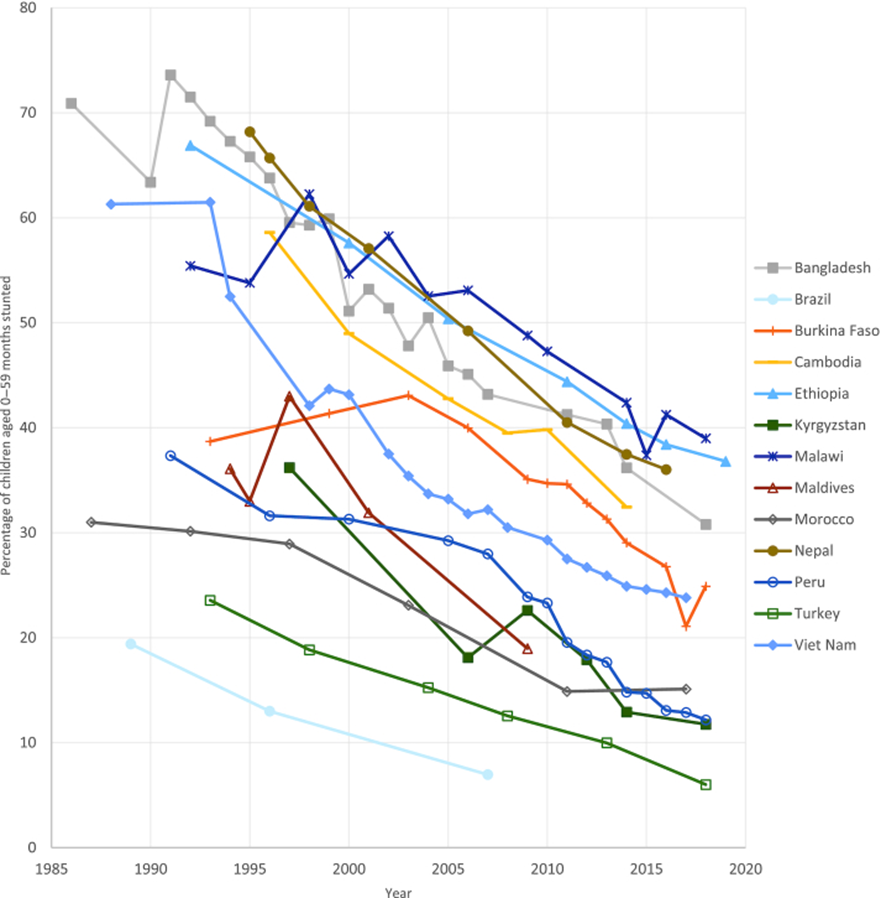
    In the U.S. the prevalence of stunting is estimated to be about 3.2% (World Health Organization, 2021). While the global prevalence has declined over the years, childhood stunting continues to be a great concern worldwide. Figure \(\PageIndex{2}\) shows the global and regional change in the number of children showing stunted growth from 1990 to 2019. In 1990, 252.8 million children under five years of age exhibited stunted growth; by 2019, this number dropped to 144 million children. The prevalence of stunting differs greatly by country. Figure \(\PageIndex{3}\) shows the longitudinal trajectory of the prevalence of stunting in thirteen countries from 1985 to 2019. While all thirteen countries show a decline, there are still significant differences between countries. Even after 2015, Malawi, Ethiopia, Nepal and Bangladesh each had a prevalence between 30% to 40%, while Morocco, Peru and Kyrgyzstan each had a prevalence between 10% to 20%.

    This bar chart shows data provided in the figure caption.
    Figure \(\PageIndex{2}\): Global and regional change of stunted growth from 1990 to 2019. Global: 1990 252.8 2019 144, East Asia and Pacific: 1990 12.8 2019 4.7, Middle East and North Africa: 1990 11.5 2019 7.1, South Asia: 1990 99.9 2019 56.1, Sub-Saharan Africa: 1990 44.4 2019 57.5. [2]
    This line chart shows data provided in figure caption
    Figure \(\PageIndex{3}\): Prevalence of childhood stunting by country.Bangladesh 71% 1995 down to 31% in 2019, Brazil had a downward trend 19% in 1988 down to 7% in 2008, Burkina Faso 38% in 1993 down to 25% in 2016 after some up and down fluctuations between those two dates, Cambodia was a downward trend from 58% in 1999 to 33% in 2014. Ethiopia was a downward trend from 66% down to 38% in 2019. Kyrgyzstan had an overall downward trend with some upward fluctuations, from 36% in 1997 to 12% in 2019. Malawi begin at 55% in 1992 with a sharp upward tick to 63% in 1999 and then a downward trend to 38% in 2018. Maldives 35% in 1993 with a sharp upward tick to 43% in 1993 and then downward to 19% in 2009. Morocco had significant up and down numbers between 1986 and 2020, however an overall downward trend from 72% in 1986 to 31% in 2018%. Nepal was a downward trend from 68% in 1995 to 38% in 2016. Peru an overall downward trend from 37% in 1992 down to 12% in 2017. Turkey overall downward trend from 23% in 1993 to 7% in 2017. Viet Nam downward trend from 68% in 1992 down to 38% in 2018. All dates and percentages are approximate. [3]

    [1] Image from CDC is in the public domain.

    [2] Image from Vaivada et al., 2020). Stunting in childhood: An overview of global burden, trends, determinants, and drivers of decline. The American Journal of Clinical Nutrition, 112, 777S-791S. CC by 4.0

    [3] Image from Vaivada et al., (2020). Stunting in childhood: An overview of global burden, trends, determinants, and drivers of decline. The American Journal of Clinical Nutrition, 112, 777S-791S. CC by 4.0


    This page titled 2.3: Growth in Body Length/Height is shared under a mixed 4.0 license and was authored, remixed, and/or curated by Todd LaMarr.