
11.9: Charting language growth in infants and toddlers
- Page ID
- 140571
Language Growth
Many times the growth of infant and toddler language development is only discussed with isolated stages and distinct milestones. The reality is that in between isolated stages and milestones, language is growing month by month (and even really day by day). In addition to presenting language milestones, it is important to acknowledge the month by month growth in comprehension and production in early language development. To illustrate what language growth looks like month by month over the first three years years, let’s examine some data.
When we talk with infants and toddlers, they can understand a lot, despite not yet being able to say much in return. Figure \(\PageIndex{1}\) illustrates the month by month development of language comprehension in children from eight months to eighteen months of age. The 50th percentile lines indicate the median growth over time. The data shows a steep upward trajectory of growth. At 8 months of age, half of the infants did not understand more than 7 words. By twelve months of age the median number of words an infant understood was around 20; however, just a few months later (fifteen months) the number of comprehensible words doubled and by eighteen months of age was around 80 comprehensible words.
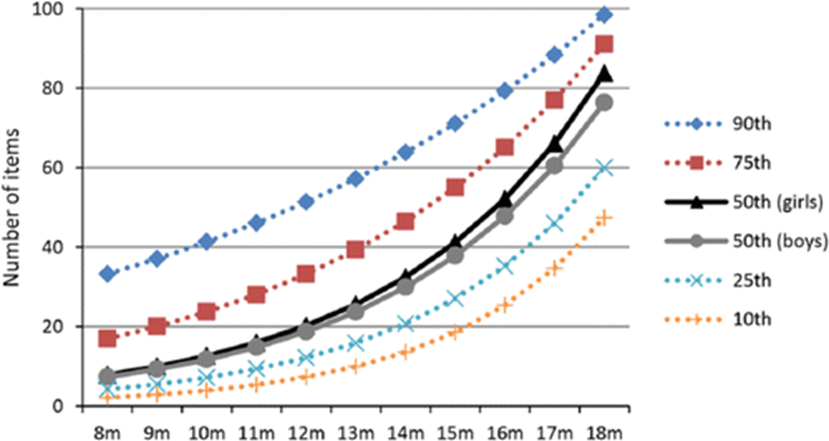
Figure \(\PageIndex{2}\) illustrates the growth curves for the same children, but this time looking at language production rather than comprehension. Comparing Figure# and Figure# allows us to notice the growth differences between language comprehension and production. The data support the well-established pattern in language acquisition literature that children’s receptive vocabulary far exceeds their expressive ability during infancy and toddlerhood.
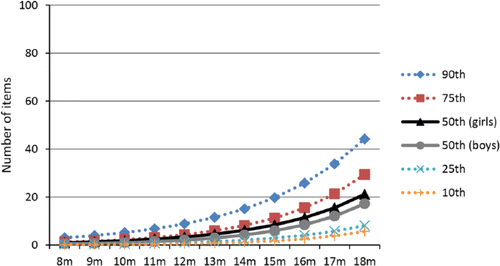
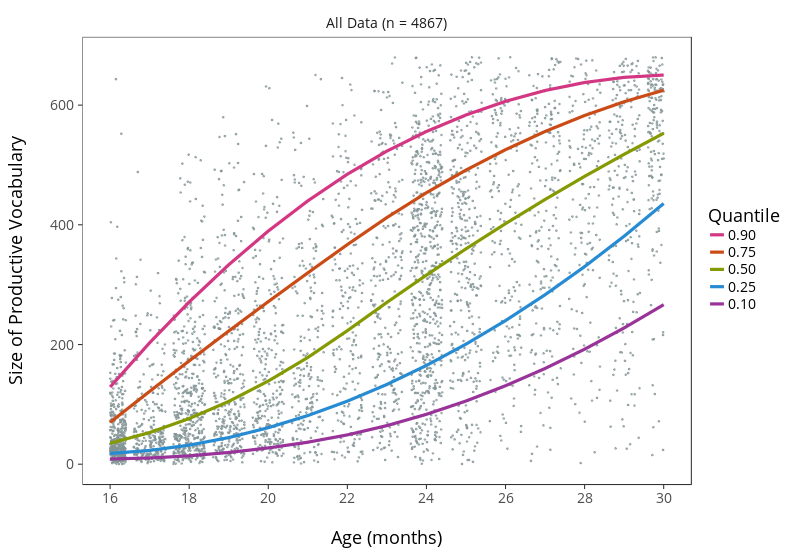
Figure \(\PageIndex{2}\) shows the language production abilities of children through eighteen months of age, with expressive ability improving from 14 to 18 months. What does language production growth look like in toddlers after 18 months of age? Figure \(\PageIndex{3}\) presents the median growth trend for the language production of 4,867 native English-speaking toddlers between 16-30 months of age in the U.S. Each grey dot represents the expressive vocabulary level of one individual child. The height of a dot represents how many words a child produces at a given age—the higher the dot is on the chart, the more words a child produces. The blue line represents the median growth curve. Notice how steep the blue line is—this illustrates how quickly expressive language abilities grow in toddlers!

Take a moment to analyze the data in Figure \(\PageIndex{3}\). What else do you notice about the data? Did you notice that the data for many children is far above the blue median line and the data for many others is located far beneath it? If so, you noticed the fact that there are early individual differences in language development. Figure \(\PageIndex{4}\) is the same data from Figure \(\PageIndex{3}\), but now five lines are present. These five lines divide the data into five different language growth trajectory curves. Notice how the top red line captures children who, at 16 months, have the highest vocabulary, the steepest growth curve in the chart and continue to have the highest vocabulary through 30 months of age. The opposite is true for the bottom purple line—these children have the lowest vocabulary at 16 months, the least steep growth curve and at 30 months, they continue to have the lowest vocabulary levels. From this chart we can see that early individual differences in language ability emerge in toddlerhood and the children with stronger language skills continue to have stronger language abilities later on. Although this chart only extends until 30 months of age, studies that have followed children longitudinally show that stronger language skills in toddlerhood is related to stronger language and cognitive abilities later in childhood (Gilkerson et al., 2018; Marchman & Fernald, 2008).
[1] Image by Frota et al., (2016). Infant communicative development assessed with the European Portuguese MacArthur–Bates Communicative Development Inventories short forms. First Language, 36(5), 525-545. CC by 3.0.