
17.1: Defining and Measuring Inequality, Mobility, and Poverty
- Last updated
- Save as PDF
- Page ID
- 3540

- Boundless
- Boundless
Defining and Measuring Poverty
Poverty is framed from a material possessions perspective, and is defined as lacking a certain amount to fulfill basic standards of living.
learning objectives
- Describe poverty and the poverty line
Poverty is framed from a material or capital possessions perspective, and is loosely defined as lacking a certain amount to fulfill basic standards of living. Absolute poverty is poverty to the extent of which an individual is deprived of the ability to fulfill basic human needs (i.e. water, shelter, food, education, etc.). The United Nations defines poverty as the inability to obtain choices and opportunities. The existence of poverty is one of the greatest challenges faced by the modern world, both in developing and developed nations. Addressing poverty is best approached through the science of understanding monetary exchanges and the creation of wealth, and thus it is useful to employ an economic perspective when discussing and providing solutions to global poverty.
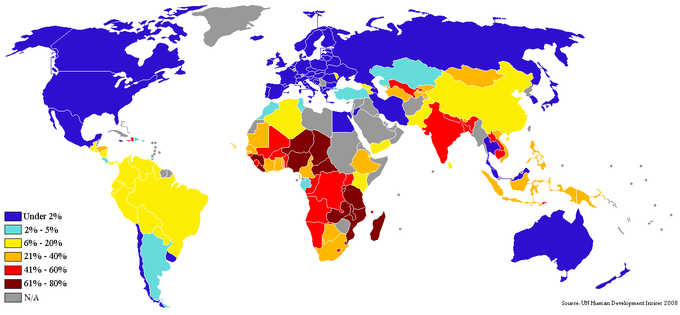
Percentage of People Living on Less than $1/Day: This map underlines the overall percentage of people in specific countries living on less than one dollar (USD) per day. The important takeaway is the wide range of countries suffering from varying levels of poverty.
The Poverty Line
When conceptually approaching the idea of a poverty line, it is useful to frame it within the context of generating an amount of income that is appropriate to ensure a reasonable standard of living for an individual. Someone below a nationally set poverty line lacks the purchasing power to fulfill their needs and capture opportunities. The United States, for example, has most recently (2012) set the poverty line at $23,050 (annually) with a total of 16% of the population falling under this level (according to the U.S. Census Bureau). Internationally, the World Bank defines extreme poverty as living on less than $1 per day (adjusted for purchasing power).
In observing poverty over time, the rates of poverty alongside the advances in economic production, demonstrates the value in technological and economic progress. The industrial revolution, the modernization (and thus increased efficiency) of agriculture, mass production in factories, technological innovation and a wide range of factors that have driven production and economies upwards have contributed to an increased standard of living. Economically, while the distribution of wealth heavily has tended to benefit the wealthy, there has been great value derived in technological progress in regards to minimizing poverty.
Measuring Poverty
Varying approaches have been developed to measure poverty levels, with a particular focus on creating standardized tools to capture a global context. Poverty is generally divided into absolute or relative poverty, with absolute concepts referring to a standard that is consistent over time and geographic location. An example of absolute poverty is the number of people without access to clean drinking water, or the number of people eating less food than the body requires for survival. Absolute poverty levels, as discussed above, essentially underline the ability for an individual to survive with autonomy. Relative poverty is an approach based more upon a benchmark, that is to say the upper echelon of society versus the poor. Income distribution measures lend insight into relative poverty levels.
One interesting perspective is the Multidimensional Poverty Index (MPI). This index was created in 2010 by the Oxford Poverty & Human Development Initiative alongside the United Nations Development Programme. It leverages a variety of dimensions and applies it to the number of people and the overall intensity across the poor to create a model to capture the extent of the poverty in the region. This dimensions include health, child mortality, nutrition, standard of living, electricity, sanitation, water, shelter (via the floor), cooking fuel and assets owned.
Defining and Measuring Income Inequality
Income inequality uses the dispersion of capital to identify how economic inequality is defined among individuals in a given economy.
learning objectives
- Apply indices of income inequality to measure global economic inequality
Income inequality utilizes the dispersion of capital to identify the way in which economic inequality is defined among a group of individuals in a given economy. Simply put, economics measures income levels and purchasing power across a society to identify averages and distributions to identify the extent of inequalities. Historically this problem was limited to the scope of differences of income and assets between people, creating separate social classes. However, as economists expand their understanding of markets, it has become increasingly clear that there is a relationship between income inequality and the potential for long-term sustainable economic growth. As a result, a wide array of income inequality scales and metrics have been generated in order to identify challenges.
Inequality Metrics
In pursuing an objective and comparable lens in which to measure income inequality, a variety of methods have been created. Models, ratios and indices include:
- Gini Index: One of the most commonly used income inequality metric is the Gini Index, which uses a straightforward 0-1 scale to illustrate deviance from perfect equality of income. A 1 on this scale is essentially socialism, or the perfect distribution of capital/goods. The derivation of the Gini ratio is found via Lorenz curves, or more specifically, the ratio of two areas in a Lorenz curve diagram. The downside to this method is that it does not specifically capture where the inequality occurs, simply the degree of severity in the income gap. This demonstrates the Gini ratio across the globe, with some interesting implications for advanced economies like the U.S.
- 20:20 Ratio: This name indicates the method; the top 20% and the bottom 20% of earners are used to derive a ratio. While this is a simple method of identifying how rich the rich are (and how poor the poor are), it unfortunately only captures these outliers (obscuring the middle 60%).
- Palma Ratio: Quite similar to the 20:20 ratio, the Palma ratio underlines the ratio between the richest 10% and the poorest 40% (dividing the former by the latter). The share of the overall economy occupied by these two groups demonstrates substantial variance from economy to economy, and serves as a strong method to identify how drastic the inequity is.
- Theil Index: The Theil Index takes a slightly different approach than the rest, identifying entropy within the system. Entropy in this context is different than that which is found in thermodynamics, primarily meaning the amount of noise or deviance from par. In this case, 0 indicates perfect equality, and 1 indicates perfect inequality. When there is perfect equality, maximum entropy occurs because earners cannot be distinguished by their incomes. The gaps between two entropies is called redundancy, which acts as a negative entropy measure in the system. Redundancy in some individuals implies scarcity of resources for others. Comparing these gaps and inequality levels (high entropy or high redundancy) is the basic premise behind the Theil Index.
- Hoover Index: Often touted as the simplest measurement to calculate, the Hoover Index derives the overall amount of income in a system and divides it by the population to create the perfect proportion of distribution in the system. In a perfectly equal economy this would equate to income levels, and the deviance from this (on a percentile scale) is representative of the inequality in the system.
To simplify the information above, the basic concept behind measuring inequality is identifying an ideal and tracking any deviance from that ideal (which would be deemed the inequality of a given system). Minimizing this inequality is the sign of a mature and advanced society with high standards of living across the board, while substantial income gaps are indicative of a developing or struggling economy. Some powerful economies, like the United States and China, demonstrate high inequality despite high economic power while others, like Switzerland or Norway, demonstrate high equality despite lower economic output. This is a critical consideration in economic policy (from a political perspective). Minimizing inequality is a central step towards an advanced society.
Defining and Measuring Economic Mobility
Economic mobility is a measurement of how capable a participant in a system can improve (or reduce) their economic status.
learning objectives
- Distinguish between types of economic mobility
Economic mobility is a measurement of how capable a participant in a system can improve (or reduce) their economic status (generally measured in monetary income). This concept of economic mobility is often considered in conjunction with ‘social mobility’, which is the capacity for an individual to change station within a society.
Types of Economic Mobility
Economic mobility can be perceived via a number of approaches, but is best summarized in the following four:
- Intergenerational: Intergenerational mobility pertains to a person’s capacity to alter their station relative to the economic status of their parents or grandparents, essentially the flexibility within a society to allow individuals to grow regardless of their initial station. Contrary to concepts of mobility in America, 42% of individuals in born into the bottom income bracket remain there. An interesting chart, measuring intergenerational income elasticity, can be found in.
- Intragenerational: Intragenerational mobility is defined by an individual’s upwards and downwards movement throughout their lifetime (both relative to their working career and their peers). This type of mobility is shorter term than intergenerational in regards to the way in which it is confined to the lifetime of that individual specifically.
- Absolute: Similar to intergenerational mobility, absolute mobility looks at how widespread economic growth improves (or reduces) an individual or a family’s income over a generational time frame. Put simply, it answers the following question: How likely is a person to exceed their parents income at a given age?
- Relative: Relative mobility, as the name implies, measures the mobility and economic growth of a particular person within the context of the system in which they work.
Closely related to the concept of economic mobility is that of socioeconomic mobility, which refers to the ability to move vertically from one social or economic class to another. This is called “vertical” mobility, which overlaps substantially with the categories discussed above.
Economists studying economic mobility have identified a number of factors that play an integral role in enabling (or blocking) participants in an economic system from achieving mobility. Some of the more well-known issues include:
- Gender: Gender is quite often a limiting factor in economic mobility, with concepts like the “glass ceiling” underlining the difficulty encountered by women in achieving high-earning status. While women have made great strides in some countries, many global economies still struggle to incorporate women into the workplace with equity.
- Race/Ethnicity: In the United States in particular there is huge inequity between Caucasian workers and that of other backgrounds (African American, Hispanic, etc.). Approaching this social tie with income inequity has taken a great deal of political reform over the years, and has much left to accomplish in terms of enabling movement across economic levels.This could in many ways be coupled with immigration, or the concept of being different socially or ethnically from a group that has historically achieved high income levels.
- Education: Access to equitable and affordable education in all places worldwide is a substantial domestic and global challenge in enabling the next generation for success. Access to the best education is highly correlated with access to the best professional opportunities, and thus the expansion and funding of effective public education lies at the center of enabling economic mobility.
Measurement Problems
Due to the high complexity of measuring equality, the accuracy of many poverty and inequality measurements can be less than ideal.
learning objectives
- Describe issues with measuring poverty and income inequality globally
As with any statistical modeling and measuring approach, there is a great deal of complexity to capture within a finite algorithmic structure, making the accuracy and efficacy of many poverty and inequality measurements less than ideal. Inequality, poverty and economic mobility in particular have a number of measurement challenges.
Gini Index
The most popular measurement of income inequality is the Gini index, which leverages a simple scale of 0-1 to derive deviance from a given perfect equality point. If a system demonstrates a Gini index of 0, the implication is that income differences among any individuals in the population will be essentially zero, while a measurement of 1 is complete income disparity. The primary drawback to this approach is that it measures relative poverty (as opposed to absolute poverty). This criticism spans across most poverty measurement systems (Thiel entropy, the 20:20 ratio, and the Palma ratio to name a few), and ultimately implies that much of what is measured as inequality does not take into account absolute gains.
For example, if an economy were to grow by 20% over 10 years, it is perfectly possible (and indeed quite likely) that the upper 20% will capture 50% gains while the bottom 20% will only capture 10% gains. That bottom 10% (assuming inflation has been accounted for) will be gaining wealth and purchasing power in absolute terms despite the fact that the Gini index will be much worse. The Gini index still has important implications about relative inequality in this circumstance, but it neglects to point out positive gains.
Criticisms of the Poverty Line
Taking into account the problems with the Gini ratio, a concept like the poverty line does an effective job in offsetting this variability. A poverty line is the determination of a specific income level in which it is considered the absolute minimum amount of capital required for an individual or family to live (and have all necessities) over the course of one year.
While there is great absolute value in utilizing a poverty line to determining the percentage of people still surviving on less than is considered the bare minimum, there are also drawbacks to this method as well. Looking at the map, one can see that measuring the percentages of individuals under the poverty line from country to country demonstrates what appears to be a graphic for comparison. However, due to the fact that poverty lines are different in different countries (because there is no standard way in which to enforce setting and measuring the poverty line) it is not relative. As a result, there is high absolute value for each country but minimal comparative value between countries. Another prospective drawback of this method is that the poverty threshold only measures when an individual is above or below it, and not the extent to which each individual deviates. Finally, it is also important to consider less quantitative components that affect the standard of living (for example, education quality, roads, access to public transportation, access to healthcare, etc.), and thus country to country comparisons are somewhat reduced in value.
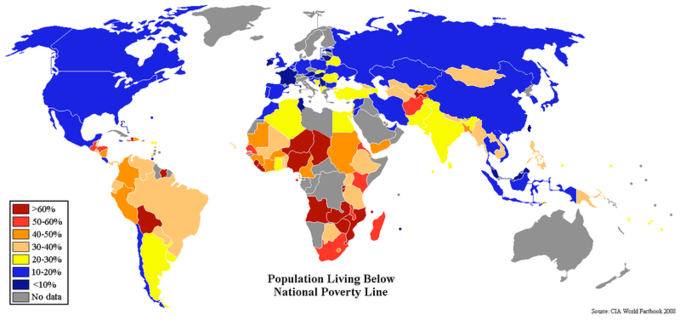
Individuals Below National Poverty Line: This graph illustrates the different percentiles of individuals under the poverty line across the world. One criticism of this method is that national poverty lines are not derived objectively in a standardized fashion, and thus there is limited value to this graphic in relative terms.
Voluntary Poverty
One interesting risk in measuring poverty is the concept of voluntary poverty, or the active pursuit of living at the absolute bare minimum. This is done as a result of lifestyle choice or religion, and is counted into poverty and inequality levels despite the fact that the individual being counted has actively pursued this place in society. While this is a somewhat unusual circumstance, it shifts the measurement of poverty in some regions (particularly those with a high population of certain beliefs or religions) higher than would be expected.
Key Points
- The United Nations defines poverty as the inability to obtain choices and opportunities.
- A poverty line pertains to the idea of generating an amount of income that is appropriate to ensure a minimum standard of living for an individual. Someone below a nationally set poverty line lacks the purchasing power to fulfill their needs and capture opportunities.
- In observing poverty over time, the rates of poverty alongside the advances in economic production, demonstrate the value in technological and economic progress.
- Poverty is generally divided into absolute or relative poverty, with absolute concepts referring to a standard consistent over time and geographic location and relative pertaining to social benchmarks.
- In pursuing an objective and comparable lens in which to measure income inequality, a variety of methods have been created.
- One of the most commonly used income inequality metric is the Gini Index, which uses a straightforward 0-1 scale to illustrate deviance from perfect income equality.
- The 20:20 Ratio and the Palma Ratio (40:10) use percentile ratios of the richest groups and poorest groups to create scales of income inequality severity.
- The Theil Index takes a slightly different approach than the rest, identifying entropy within the system. Entropy, in this case, means the amount of noise or deviance from par, which is expressed as a scale (0 – 1); 0 indicates perfect equality, and 1 indicates perfect inequality.
- Often touted as the simplest measurement to calculate, the Hoover Index derives the overall amount of income in a system and divides it by the population to create the perfect proportion of distribution in the system.
- This concept of economic mobility is often considered in conjunction with “social mobility,” which is the capacity for an individual to change station within a society.
- Economic mobility can be perceived via a number of approaches, but is best summarized as inter-generational, intra-generational, absolute, or relative.
- Closely related to the concept of economic mobility is that of socio-economic mobility, referring to the ability to move vertically from one social or economic class to another. This is called “vertical” mobility.
- Economists studying economic mobility have identified a number of factors that play an integral role in enabling (or blocking) participants in an economic system from achieving mobility, such as gender, race and education.
- The most popular measurement of income inequality is the Gini ratio, which leverages a simple scale of 0-1 to derive deviance from a given perfect equality point. The primary drawback to this approach is that it measures relative poverty (as opposed to absolute poverty).
- The poverty line is a useful absolute measurement, but suffers from having no global standard set (for comparative value), having limited nuance to measure deviations from the poverty line, and failing to incorporate intangible societal assets such as health care.
- One interesting risk in measuring poverty is the concept of voluntary poverty, or the active pursuit of living at the absolute bare minimum.
- Overall, while measuring inequality is a necessary and useful economic perspective, there are inherent statistical drawbacks in mathematically approaching complex societal issues.
Key Terms
- purchasing power: The amount of goods and services that can be bought with a unit of currency or by consumers.
- Poverty line: The threshold of poverty, below which one’s income does not cover necessities.
- entropy: A measure of the amount of information and noise present in a signal.
- glass ceiling: An unwritten, uncodified barrier to further promotion or progression for a member of a specific demographic group.
- Economic mobility: The ability of an individual or family to improve their income, and social status, in an individual lifetime or between generations.
- Gini Index: A measure of income distribution.
LICENSES AND ATTRIBUTIONS
CC LICENSED CONTENT, SPECIFIC ATTRIBUTION
- purchasing power. Provided by: Wiktionary. Located at: en.wiktionary.org/wiki/purchasing_power. License: CC BY-SA: Attribution-ShareAlike
- Measuring poverty. Provided by: Wikipedia. Located at: en.Wikipedia.org/wiki/Measuring_poverty. License: CC BY-SA: Attribution-ShareAlike
- Poverty threshold. Provided by: Wikipedia. Located at: en.Wikipedia.org/wiki/Poverty_threshold. License: CC BY-SA: Attribution-ShareAlike
- Measuring poverty. Provided by: Wikipedia. Located at: en.Wikipedia.org/wiki/Measuring_poverty. License: CC BY-SA: Attribution-ShareAlike
- Poverty in the United States. Provided by: Wikipedia. Located at: en.Wikipedia.org/wiki/Poverty_in_the_United_States. License: CC BY-SA: Attribution-ShareAlike
- Multidimensional Poverty Index. Provided by: Wikipedia. Located at: en.Wikipedia.org/wiki/Multidimensional_Poverty_Index. License: CC BY-SA: Attribution-ShareAlike
- Income inequality metrics. Provided by: Wikipedia. Located at: en.Wikipedia.org/wiki/Income_inequality_metrics. License: CC BY-SA: Attribution-ShareAlike
- Poverty line. Provided by: Wiktionary. Located at: en.wiktionary.org/wiki/Poverty+line. License: CC BY-SA: Attribution-ShareAlike
- Provided by: Wikimedia. Located at: upload.wikimedia.org/wikipedi..._2007-2008.png. License: CC BY-SA: Attribution-ShareAlike
- Income inequality metrics. Provided by: Wikipedia. Located at: en.Wikipedia.org/wiki/Income_inequality_metrics. License: CC BY-SA: Attribution-ShareAlike
- entropy. Provided by: Wikipedia. Located at: en.Wikipedia.org/wiki/entropy. License: CC BY-SA: Attribution-ShareAlike
- Provided by: Wikimedia. Located at: upload.wikimedia.org/Wikipedia/commons/1/1d/Percentage_population_living_on_less_than_1_dollar_day_2007-2008.png. License: CC BY-SA: Attribution-ShareAlike
- glass ceiling. Provided by: Wiktionary. Located at: en.wiktionary.org/wiki/glass_ceiling. License: CC BY-SA: Attribution-ShareAlike
- economic mobility. Provided by: Wiktionary. Located at: en.wiktionary.org/wiki/economic_mobility. License: CC BY-SA: Attribution-ShareAlike
- Socio-economic mobility in the United States. Provided by: Wikipedia. Located at: en.Wikipedia.org/wiki/Socio-economic_mobility_in_the_United_States. License: CC BY-SA: Attribution-ShareAlike
- Economic mobility. Provided by: Wiktionary. Located at: en.wiktionary.org/wiki/Economic+mobility. License: CC BY-SA: Attribution-ShareAlike
- Provided by: Wikimedia. Located at: upload.wikimedia.org/Wikipedia/commons/1/1d/Percentage_population_living_on_less_than_1_dollar_day_2007-2008.png. License: CC BY-SA: Attribution-ShareAlike
- IB Economics/Development Economics/Barriers to Economic Growth. Provided by: Wikibooks. Located at: en.wikibooks.org/wiki/IB_Econ...conomic_Growth. License: CC BY-SA: Attribution-ShareAlike
- Gini coefficient. Provided by: Wikipedia. Located at: en.Wikipedia.org/wiki/Gini_coefficient. License: CC BY-SA: Attribution-ShareAlike
- Poverty threshold. Provided by: Wikipedia. Located at: en.Wikipedia.org/wiki/Poverty_threshold. License: CC BY-SA: Attribution-ShareAlike
- Poverty line. Provided by: Wiktionary. Located at: en.wiktionary.org/wiki/Poverty+line. License: CC BY-SA: Attribution-ShareAlike
- Boundless. Provided by: Boundless Learning. Located at: www.boundless.com//economics/...ion/gini-index. License: CC BY-SA: Attribution-ShareAlike
- Provided by: Wikimedia. Located at: upload.wikimedia.org/Wikipedia/commons/1/1d/Percentage_population_living_on_less_than_1_dollar_day_2007-2008.png. License: CC BY-SA: Attribution-ShareAlike
- Provided by: Wikimedia. Located at: upload.wikimedia.org/wikipedi..._World_Map.png. License: CC BY-SA: Attribution-ShareAlike