
8: Behavioral Economics
- Last updated
- Save as PDF
- Page ID
- 58473

Behavioral Economics
The field of Behavioral Economics (and Behavioral Finance) is a growing research area that focuses on how decisions are actually made. It is closely tied to psychology and neuroscience. Behavioral economists reject the idea of utility maximization as an assumed black box. Both experimental methods and sophisticated procedures (such as MRI brain scans) are used to examine how real-world problems are actually solved. A number of results have emerged that challenge the conventional wisdom in mainstream economics.
One area of long-standing interest in psychology involves repeated choice problems. This chapter focuses on a particular kind of repeated choice in which the satisfaction obtained currently depends on past decisions. This is called distributed choice.
Suppose you are deciding whether to watch TV or play a video game. You face this choice repeatedly. The satisfaction from watching TV or playing a video game depends on how often that choice has been made before. What is the best combination of TV and video games over a period of time and, more importantly, how well do people handle this kind of repeated choice?
Instead of explaining why the repeated choice optimization problem is difficult and presenting results from human trials, it is more fun (and you will learn more) to let you first participate in an experiment.
The Choice Game
STEP Open the Excel workbook Melioration.xls and read the Intro sheet, then go to the Choice Game sheet to play this simple game.
Your goal is to click the A or B buttons as many times as possible in 10 minutes. When you make a choice, by clicking on one of the buttons, you are forced to wait. Waiting is costly because you cannot click (make another choice) while waiting.
STEP Click the  option button (near the top left corner of the screen) to see how the game works.
You get up to 100 practice trials. In practice mode, time is not kept. You can take as long as you want between button clicks. Practice now.
There is definitely something going on that you are trying to figure out and there is an optimal strategy. You can click the same button over and over or switch back and forth.
Are you ready to play? Unlike practice, when you play, a timer will be running. You will not use the buttons on the sheet like you did in practice mode. The buttons will be on a dialog box, right next to each other. You will have 10 minutes to make as many choices as possible. The time remaining will be displayed as you play.
Ten minutes might be too long for you to play so click the  button if you want to stop playing. As long as you start play and make a few choices, you will be able to continue working and learning about melioration.
STEP Click the  option button. Good luck!
After you finish the game, a message box displays your score and a Results sheet shows a record of your picks. It reports results based on a full ten minutes of play, so if you stopped prematurely, you can ignore your results.
Let’s deconstruct this game and see how it works. Figure 8.1 shows the first 10 choices made by a player. The player started with A, then switched to B with his 7th choice, but switched back to A, then ended with B.
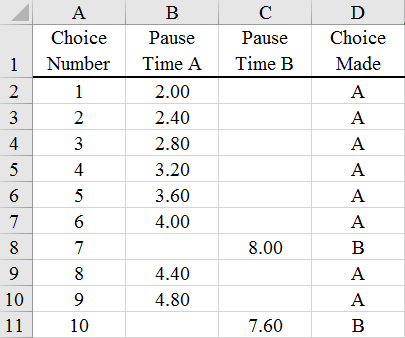 Figure 8.1: Ten plays of the game.
STEP You can see the full record of yet another player by clicking the  button (near cell G9 in the Results sheet, which was revealed when you finished playing the choice game).
This player tried streaks of A and B. Notice how the time paused changed.
These results sheets also compare the number of choices made to the maximum possible and computes a score as a percentage of the maximum. Let’s find out how the maximum can be attained and why people are usually so bad at playing this game.
Actual Results
Experimental trials with this game were conducted by Herrnstein and Prelec (1991) and you can compare how you did to the average result (and to the player in the MoreResults sheet).
STEP Click the  button in the MoreResults sheet.
The Data sheet shows how 17 subjects played the choice game that you just played. Each dot in the chart, reproduced in Figure 8.2, shows the fraction of times that a player chose A (on the x axis) and the corresponding average delay endured by that player (on the y axis). The player with the shortest delay, the first one in the table, also has the most choices (number of choices = 600/average delay) and is the winner in this set of players. How did you do?
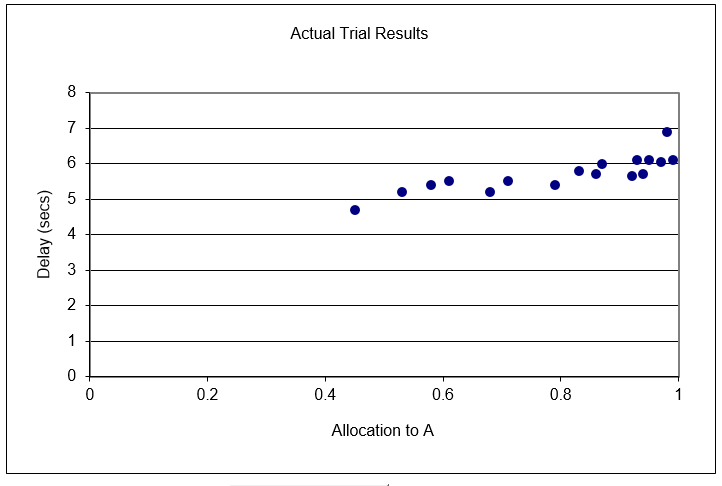
Figure 8.2: Actual results from a single session of the choice game.
Source: Melioration.xls!Data, revealed after game played.
STEP To add your result to the chart in Excel, copy your results from cells J2 and K2 of the Results sheet, select cell A23 in the Data sheet, and Paste Special (Values) (or simply type in the two numbers). A red dot will appear in the chart. This shows how you did.
Did you beat the best player out of the 17 in the chart? We know you could have because even the best player in that group of 17 failed to optimize. The explanation for this failure requires that we understand the delay function for each choice.
The heart of the choice game is the wait time between choices. The duration of the pause is a function of the previous 10 choices (including the current choice). For choice A, the wait time, in seconds, is 2 + 0.4 x Proportion of A Choices in the last 10 choices. So, if the last 10 choices had been B, then A would have a very short and satisfying pause time of just 2 seconds. As you click on A, however, the pause time for choice A rises by 0.4 seconds until it hits a maximum of 6 seconds.
Choice B’s wait time is determined by 8 - 0.4 x Proportion of B Choices in the last 10 choices. As you click on B, the duration of the pause gets lower and lower until reaching a minimum of 4 seconds.
STEP Confirm that the wait times were determined as described by returning to the three results sheets and examining the pause times in columns B and C.
You can see that the first clicks of A and B had pause times of 2 and 8 seconds, respectively. You can also check that each pause time is following the functions described above. The MoreResults sheet with the streaky A and B strategy makes it easy to see the mechanics of the choice game.
Choice A exhibits increasing marginal costevery time you click on A, you are penalized and forced to wait longer. Choice B rewards you with a decrease in wait time when it is clicked, but the wait time starts very high so you have to be persistent and stick to it. Plus, choice A is always 2 seconds lower than choice B so you are constantly being lured toward choice A.
Most people play this game by being attracted to A’s short wait time, until it gets unbearable and they switch to B. But they can’t stay with B long because it is painful to wait at first and they do not have the patience and self-discipline to stick with B. Sound familiar? B could be exercise or dieting or studyingyou know you should and it gets easier if you stick to it, but it can be hard to start.
Now that you know the rules of the game, how do you actually optimize with this game? Simplestart with choice B and never deviate.
STEP To see this optimal strategy in action, go to the Solution sheet by clicking the 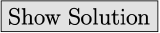 button in the Data sheet (below the chart).
Column B shows what happens when you exclusively choose A. It starts well, but you end up with many 6 second pauses.
STEP Scroll down to see that you make 103 choices in 600 seconds, yielding an average delay of 5.8 seconds. This is a poor outcome.
Column F displays what happens when B is exclusively chosen. The first few wait times are long, but each choice of B lowers the wait time until the minimum, 4 seconds, is reached.
STEP Scroll down to see that clicking choice B every time lets you make 144 choices (with an average delay of 4.167 seconds).
The strategy of choosing B exclusively cannot be beat (except for an endgame correction, which is one of the exercise questions). If the player switches from B to A, the temporary gain is swamped by higher wait times when the inevitable switch back to B occurs.
To be sure that this point is clear, consider switching after having reached the 4 second minimum pause time for choice B. What would happen?
STEP Change cell K15 (in the Solution sheet) to A.
Five consecutive A choices are made and each one has a pause time less than or equal to four seconds, as shown in column L. Thus, we have saved time. But when we switch back to B (since we know A’s pause time will continue to rise and we can get to 4 seconds with B), we have to suffer higher pause times. The trade-off is not worth it. We end up making fewer choices (142 instead of 144) and suffering a longer average delay.
The Solution sheet makes clear the following key point: The optimal strategy is to choose B exclusively and never deviate. If you failed to do this, do not worry; you have plenty of company. Very few humans figure this out.
Melioration Explained
Herrnstein and Prelec (1991) designed the experiment to test for the presence of something called melioration (pronounced mee-lee-uh-RAY-shun). To meliorate (or ameliorate) means to make better or more tolerable. Melioration says that we are drawn to choices that immediately reduce pain or give immediate satisfaction. We do a poor job of maximizing when there is a trade-off between short- and long-run returns. We are shortsighted and look to make immediate improvements. In fact, melioration has been found in other animals besides humans.
The attraction of switching to A and having the pause time fall is melioration at work. The immediate pain of waiting is lessened and, thus, players are drawn toward choice A.
In addition to the actual choices from the 17 players, Figure 8.3 shows wait times for choices A and B given the proportion of A choices in the previous 10. It is easy to see, once again, that the optimal solution is to choose B exclusively because that lets you travel down the solid line to the intercept at 4 seconds. If you ever jump on the A train, you are swept upwards toward a 6-second wait time.
Figure 8.3: Understanding melioration.
Source: Melioration.xls!Data, revealed after game played.
Figure 8.3 shows that if the last 10 choices were B and then A was chosen, the player would immediately gain a reduction in wait time from 4 to 2 seconds (jumping from the higher to the lower line). For a few choices, the player would be better off, but after the 5th consecutive A choice, the wait time would be greater than 4 seconds. The player would be forced to endure longer wait times than would have been obtained by sticking with B.
Furthermore, it is hard to switch to B because wait time immediately jumps by 2 seconds. The player will have to suffer through the ride down the B line, with choice A promising a 2-second decrease with every click. The immediate attraction of the 2-second decrease is the core of the melioration process that guides subjects to choose A.
Figure 8.3 makes clear that the 17 human subjects who played the choice game failed to optimize. The fraction of allocation to A should be zero, but most players do not do this. This begs the question, so what?
Herrnstein and Prelec (1991) argue that the lack of optimization is a big deal. For them, choice is often not a single, isolated decision, but a series of many decisions, distributed over time. Frequency of athletic exercise, buying lottery tickets, choices of restaurants, and rate of work in freelance occupations are some of the examples offered.
For all of these distributed choice problems, melioration is common and this means people systematically fail to optimize. "This would imply that preferences as revealed by the marketplace may be a distortion of the true underlying preferences" (Herrnstein and Prelec, 1991, p. 137). Melioration helps explain complaints about one’s own behavior (such as exercising too little), which is part of a growing literature on self-control. It also may contribute to the study of impulsiveness and addiction.
Of course, this presumes that the laboratory findings carry over to real-world settings. This is often an Achilles’ heel of experimental economics. Results are often criticized as having little external validity because they are based on fake scenarios played by college students. Herrnstein and Prelec (1991) acknowledge that little money was at stake (they paid their players based on performance), but they rely on two other motivating factors. "First, delays are genuinely annoying and the difference between two and four seconds is not trivial, as any computer user will appreciate. Second, the ‘puzzle’ nature of the experiment presents a challenge that is presumably satisfying to solve" (Herrnstein and Prelec, 1991, p. 144).
Others have tried to nail down exactly what causes melioration and how it can be overcome. Neth, Sims, and Gray (2005, p. 357) were surprised:
We hypothesized that frequent and informative feedback about optimal performance might be the key to enable people to overcome the documented tendency to meliorate when choices are rewarded probabilistically. Much to our surprise, this intuition turned out to be mistaken. Instead of maximizing, 19 out of 22 participants demonstrated a clear bias towards melioration, regardless of feedback condition.
The Future of Behavioral Economics
With faculty, courses, conferences, and specialized journals, there is no doubt that Behavioral Economics is here to stay. In 2002, the Nobel Prize in Economic Sciences was awarded to Daniel Kahneman and Vernon Smith for work incorporating psychology and laboratory methods in the study of decision making. Richard Thaler won the Nobel in 2017 for his contributions to behavioral economics.
Unlike conventional economics, which simply assumes optimizing behavior and rationality, behavioral economists seek to determine under what conditions agents struggle to optimize. They work with psychologists and neuroscientists to devise tests and laboratory experiments. The key result is that they find persistently sub-optimizing behavior.
Melioration is but one simple example of work in this area. Melioration means that decision makers fail to optimize because they focus on the small (immediate, single choice) instead of the large (future, many choices). This can be applied any time that incremental steps lead to an undesirable place:
A person does not normally make a once-and-for-all decision to become an exercise junkie, a miser, a glutton, a profligate, or a gambler; rather, he slips into the pattern through a myriad of innocent, or almost innocent choices, each of which carries little weight. Indeed, he may be the last one to recognize "how far he has slipped," and may take corrective action only when prompted by others. (Herrnstein and Prelec, 1991, p. 149)
According to the behavioral economists, the list of examples where humans struggle to optimize is actually quite long. Evaluating probabilities (such as risk), choice over time, and misperception of reality are all areas being actively studied.
It remains unclear whether the results being generated by behavioral economists are merely a series of peculiar puzzles that will extend the boundaries of economics or more serious anomalies that will one day bring down the paradigm of rationality and optimizing behavior that is the hallmark of modern, mainstream economics.
Exercises
If you did the Q&A problems and changed the parameters, set them back to the original values (2 and 0.4 for A and 8 and \(-0.4\) for B).
- With your observation included, copy and paste the chart titled Actual Trial Results in a Word document. Comment briefly on how you did.
- What endgame correction could be implemented to increase the total number of choices? What is the true, exact maximum number of choices? Explain.
Herrnstein and Prelec (1991), p. 142, point out that, "In fact, the subjects showed no evidence of having been influenced by the endgame contingency."
- With columns Q:U in the Solution sheet, use Solver to find the optimal solution to the choice game. Notice how the choice variables have been constrained. How does Solver do? Explain.
- Training someone to touch type does not guarantee continued touch typing in the workplace. How would melioration explain this result?
References
The epigraph is from a course available freely at ocw.mit.edu. The course description in the epigraph was from the Spring 2004 version of Behavioral Economics and Finance (see ocw.mit.edu/courses/economics/14-127-behavioral-economics-and-finance-spring-2004/). The readings for this course include introductory and more advanced work.
The repeated choice problem in this chapter is based on two papers: (1) Richard J. Herrnstein and Drazen Prelec, “Melioration: A Theory of Distributed Choice,” The Journal of Economic Perspectives, Vol. 5, No. 3 (Summer, 1991), pp. 137–156, www.jstor.org/stable/1942800 and (2) Herrnstein and Prelec’s “Melioration,” pages 235–263 in Choice Over Time, edited by George Loewenstein and Jon Elster (1992).
Herrnstein, a psychologist, teamed up with Charles Murray, a political scientist, to write a controversial book titled The Bell Curve: Intelligence and Class Structure in American Life (1994). The book argued that nature (IQ) is more important than nurture (socioeconomic status) in explaining a wide range of outcomes.
Another paper specifically focused on melioration is Hansjörg Neth, Chris R. Sims, and Wayne D. Gray, "Melioration Despite More Information: The Role of Feedback Frequency in Stable Suboptimal Performance," Proceedings of the Human Factors and Ergonomics Society 49th Annual Meeting, 2005, doi.org/10.1177/154193120504900330.
There are many books on behavioral economics and finance. A classic is from Nobel Prize winner Richard Thaler, The Winner’s Curse: Paradoxes and Anomalies of Economic Life (1994). This is a good place to start learning about behavioral economics. Other good reads include the following:
Dan Ariely, Predictably Irrational: The Hidden Forces that Shape Our Decisions (2008).
Daniel Kahneman, Thinking Fast and Slow (2011).
Michael Lewis, The Undoing Project: A Friendship that Changed Our Minds (2016).
Richard Thaler, Misbehaving: The Making of Behavioral Economics (2015).
Richard Thaler and Cass Sunstein, Nudge: Improving Decisions About Health, Wealth, and Happiness (2008).