Taxes are often imposed to provide government revenue. The government also uses taxes to decrease the consumption of a good such as alcohol or tobacco. These taxes are called “sin taxes,” on goods that are not favored by society. These goods often have inelastic demands, which allows the government to apply a tax and earn revenues. Taxes can also be used to meet environmental objectives, or other societal goals: goods such as gasoline and coal emissions are taxed.
There are two types of tax: (1) specific tax, and (2) ad valorem tax.
Specific Tax = A tax imposed per-unit of the good to be taxed.
Ad Valorem Tax = A tax imposed as a percentage of the good to be taxed.
Both types of tax have the same qualitative effects, so we will study a specific, or per-unit tax (\(t =\) USD/unit). Taxes result in price changes for both buyers and sellers of the taxed good. The welfare analysis of a tax provides important results on who pays for the tax: the buyers or sellers? The term, “tax incidence,” refers to how a tax is divided between buyers and sellers. Let \(P_b\) be the buyer’s price, and \(P_s\) be the seller’s price. In markets without a tax, buyers and sellers both pay the same equilibrium market price \((P_b = P_s = P^e)\). In a market for a taxed good, however, this equality is broken. With a tax, the buyer’s price is higher than the seller’s price by the amount of the tax:
\[P_b = P_s + t\nonumber\]
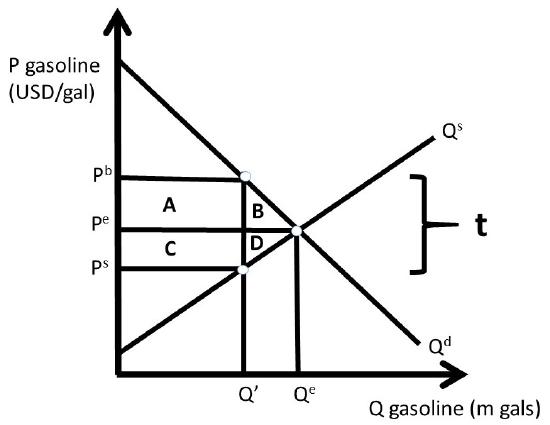
Economists say that the tax drives a wedge between the buyer’s price and the seller’s price, as shown in Figure \(\PageIndex{1}\). The specific tax \((t)\) is equal to the vertical distance between \(P_b\) and \(P_s\). The tax incidence, or who pays for the tax, depends of the elasticities of supply and demand.
Figure \(\PageIndex{1}\): Tax on Gasoline
Welfare Analysis of a Tax
The welfare analysis of the tax compares the initial market equilibrium with the post-tax equilibrium.
\[ΔCS = – A – B,\nonumber\]
\[ΔPS = – C – D,\nonumber\]
\[ΔG = + A + C,\nonumber\]
\[ΔSW = – B – D,\nonumber\]
and
\[DWL = B + D.\nonumber\]
In Figure \(\PageIndex{1}\), the incidence of the tax is equal between buyers and sellers of gasoline \((P^b – P^e = P^e – P^s)\). This is because the supply and demand curves are drawn symmetrically. In the real world, the tax incidence will depend on the supply and demand elasticities. The pass through fraction is the percentage of the tax “passed through” from producers to consumers.
\[\textbf{Pass Through Fraction } = \frac{E^s}{E^s – E^d}\nonumber\]
We will calculate this for the gasoline market in the next section.
Quantitative Welfare Analysis of a Tax
Suppose that the inverse demand and supply of gasoline are given by:
\[P_b = 8 – Q^d,\nonumber\]
and
\[P_s = 2 + Q^s,\nonumber\]
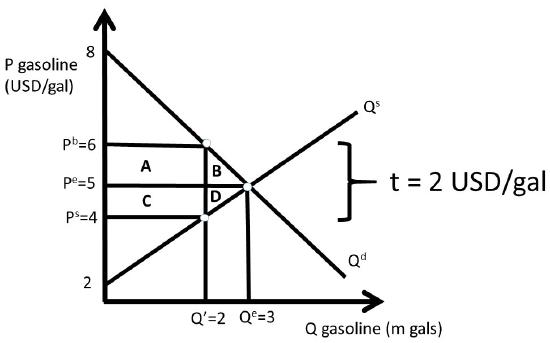
Where \(P\) is the price of gasoline in USD/gal, and \(Q\) is the quantity of gasoline in million gallons. Market equilibrium is found where supply equals demand: \(Q^e = 3\) million gallons of gasoline and \(P^e = P_b = P_s = 5\) USD/gal of gasoline (Figure \(\PageIndex{2}\)).
Figure \(\PageIndex{2}\): Tax on Gasoline
With the tax, the price relationship is given by:
\[P_b = P_s + t.\nonumber\]
Assume that the government sets the tax equal to 2 USD/gal \((t = 2)\). Substitution of the inverse supply and demand equations into the price equation yields:
\[8 – Q^d = 2 + Q^s + 2\nonumber\]
Since \(Q^d = Q^s = Q’\) after the tax:
\[\begin{align*} 4 &= 2Q’\\[4pt] Q’ &= 2 \text{ million gallons of gasoline}.\end{align*}\]
The quantity can be substituted into the inverse supply and demand equations to find the buyer’s and seller’s prices.
\[P_b = 6 \text{ USD/gal,}\nonumber\]
and
\[P_s = 4 \text{ USD/gal.}\nonumber\]
These prices are shown in Figure \(\PageIndex{2}\). The welfare analysis is:
\[\begin{align*}ΔCS &= – A – B = – 2.5 \text{ USD million}\\[4pt] ΔPS &= – C – D = – 2.5 \text{ USD million}\\[4pt] ΔG &= + A + C = + 4 \text{ USD million}\\[4pt] ΔSW &= – B – D = – 1 \text{ USD million}\\[4pt] DWL &= B + D = + 1 USD \text{ million}\end{align*}\]
Note that the change in social welfare equals the sum of the welfare changes due to the tax: \(ΔSW = ΔCS + ΔPS + ΔG\).
The pass through fraction can now be calculated to find the tax incidence.
\[PTF = \frac{E_s}{E_s – E_d}\nonumber\]
The elasticity of demand at the market equilibrium is equal to \(-\dfrac{5}{3}\), and the supply elasticity is \(+\dfrac{5}{3}\). See Section 1.4.10 above for a review of how to calculate elasticities.
This result shows that consumers pay for exactly one half of the tax, and producers pay for one half of the tax. The tax achieved the objective of increasing government revenues, but it did lower the quantity of the good produced and consumed, with lower social welfare. In free markets, consumers re able to pay the lower market price and consume more of the good. Producers receive a higher price, and produce and sell a larger quantity of the good than in the no-tax case. Therefore, taxes imposed by the government decrease social welfare, but allow the government to provide goods and services such as national defense at the federal level; highways, schools, and jails at the State level; and roads and parks at the local level. The next section will discuss subsidies.