After you have read this section, you should be able to answer the following questions:
What factors underlie the demand for housing?
What factors underlie the supply of housing?
What determines the amount of housing traded and the price of housing?
The first two articles we quoted from made it clear that the housing market was heavily affected by the financial crisis. More than that, it was where the crisis began—and so it is where we begin our story.
We start with the market for new homes, which are part of real gross domestic product (real GDP). (The buying and selling of existing homes is not counted in GDP.) New homes are supplied by construction firms and demanded by families wishing to live in a new home. New homes are also bought by speculators who purchase houses in the hope that they can resell them for a higher price in the future.
Toolkit: Section 31.9 "Supply and Demand"
Supply and demand is a framework we use to explain and predict the equilibrium price and quantity of a good. A point on the market supply curve shows the quantity that suppliers are willing to sell for a given price. A point on the market demand curve shows the quantity that demanders are willing to buy for a given price. The intersection of supply and demand determines the equilibrium price and quantity that will prevail in the market.
The toolkit contains a presentation of supply and demand that you can use for reference purposes in this and the following chapters.
The supply-and-demand framework applies to the case that economists call a competitive market. A market is said to be competitive, or, more precisely, to exhibit perfect competition, under two conditions:
There are many buyers and many sellers, all of whom are small relative to the market.
The goods that sellers produce are perfect substitutes.
In a competitive market, buyers and sellers take the price as given; they think their actions have no effect on the price in the market.
Demand
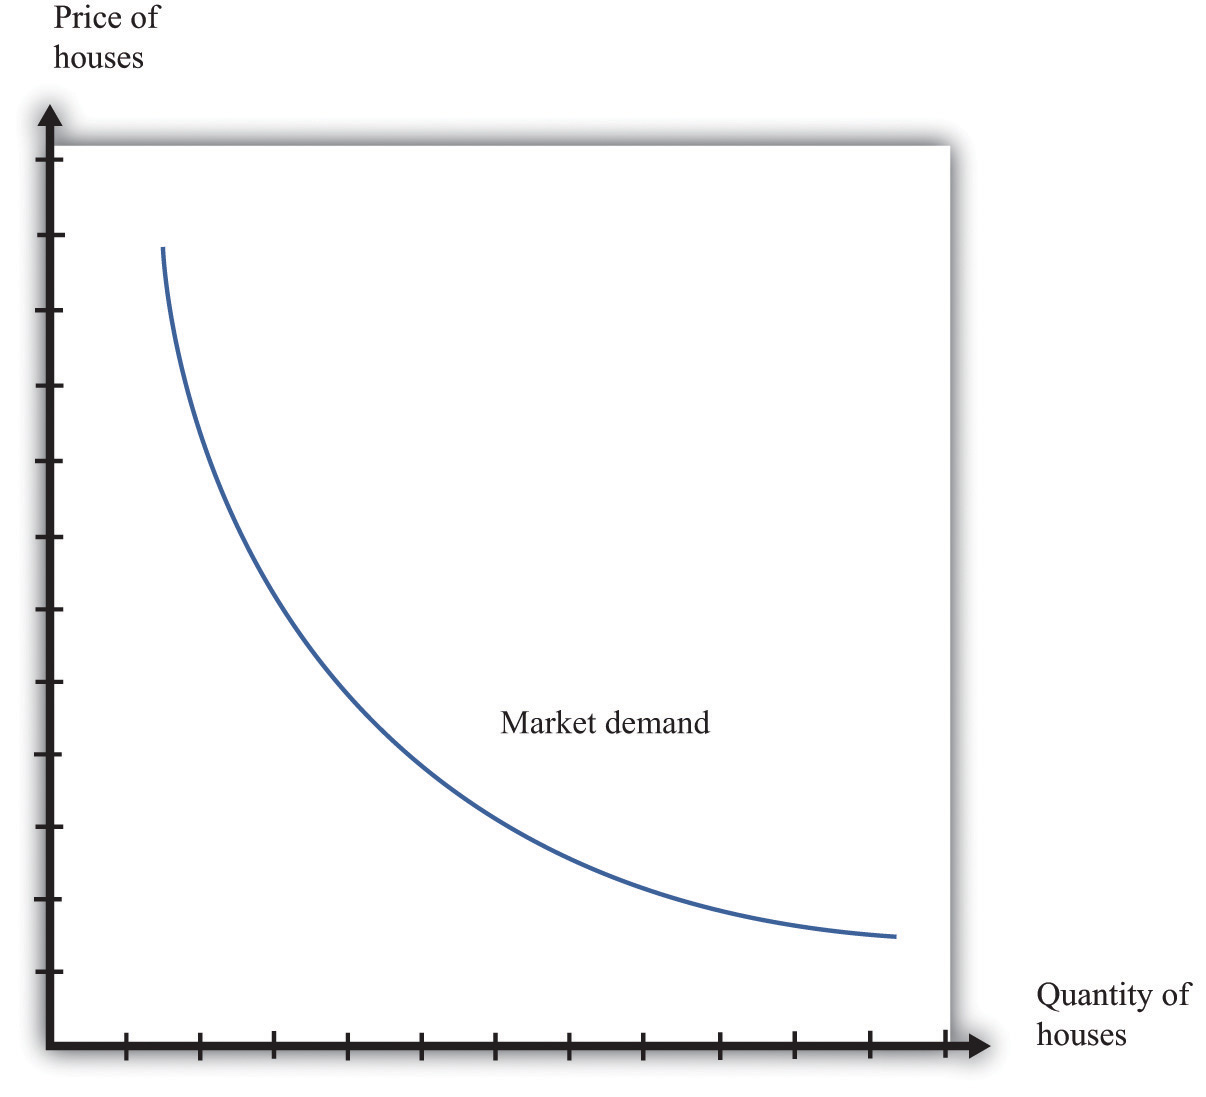
The market demand for housing is shown in Figure 19.2.1 "The Market Demand for Houses". We call this the market demand curve because it reflects the choices of the many households in the economy. In macroeconomics, we typically look at markets at this level of aggregation and do not worry much about the individual decisions that underlie curves such as this one.
Figure \(\PageIndex{1}\): The Market Demand for Houses
The market demand curve shows the quantity of houses demanded at each price.
As the price of housing decreases, the quantity demanded increases. This is an example of the law of demand, which derives from two effects:
As the price of a good or service decreases, more individuals choose to buy a positive quantity rather than zero.
As the price of a good or a service decreases, individuals choose to buy a larger quantity.
In the case of the market for housing, the first of these is more important. Most people own either zero houses or one house. As houses become cheaper, more people decide that they can afford a house, so the quantity demanded increases. A few people might decide to buy an additional house, but they would presumably be in the rich minority. For other goods, such as chocolate bars or shoeshines, the second effect is more important: as price decreases, people increase the quantity that they buy.
Shifts in Demand
When we draw a demand curve, we are varying the price but holding everything else fixed. In particular, we hold fixed the level of income, the prices of other goods and services in the economy, and the tastes of households. If these other factors change, then the market demand curve will shift—that is, the quantity demanded will change at each price.
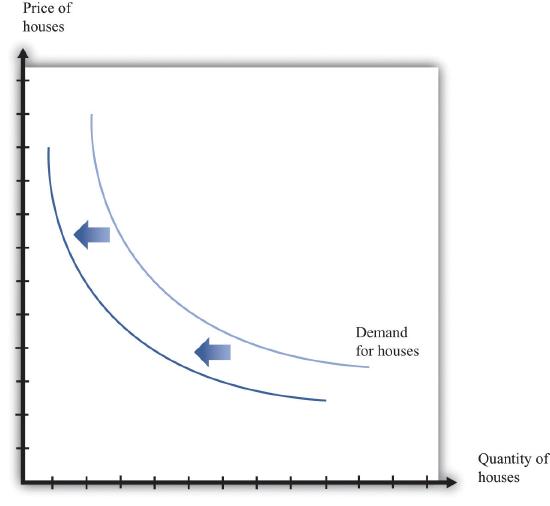
A leftward shift of the market demand curve for houses, as indicated in Figure 19.2.2 "A Shift in the Market Demand Curve", could be caused by many factors, including the following:
A decrease in the incomes of households in the market
Concerns about the future health of the economy
A reduction in the price of a typical apartment rental
An increase in the interest rates for mortgages
A change in social tastes so that buying a house is no longer viewed as a status symbol
Figure \(\PageIndex{2}\): A Shift in the Market Demand Curve
If there is a decrease in demand for houses, then fewer houses are demanded at each price. The demand curve shifts leftward.
Supply
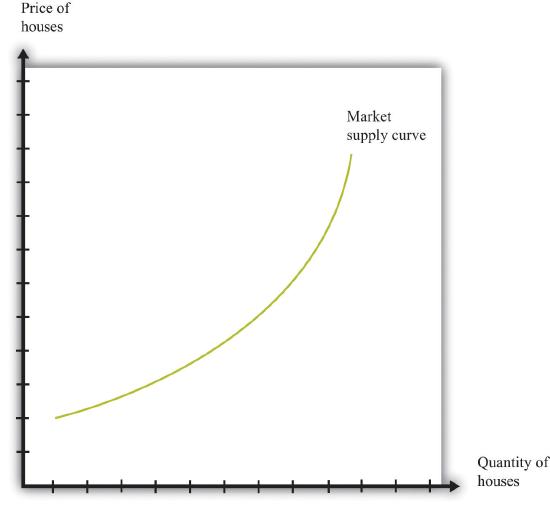
The counterpart to the market demand curve is the market supply curve, which is obtained by adding together the individual supply curves in the economy. The supply curve slopes upward: as price increases, the quantity supplied to the market increases. As with demand, there are two underlying effects.
As price increases, more firms decide to enter the market—that is, these firms produce some positive quantity rather than zero.
As price increases, firms increase the quantity that they wish to produce.
Figure \(\PageIndex{3}\): The Market Supply of Houses
The market supply curve shows the quantity of houses supplied at each price. It has a positive slope: as the price of houses increases, the number of houses supplied to the market increases as well.
Shifts in Supply
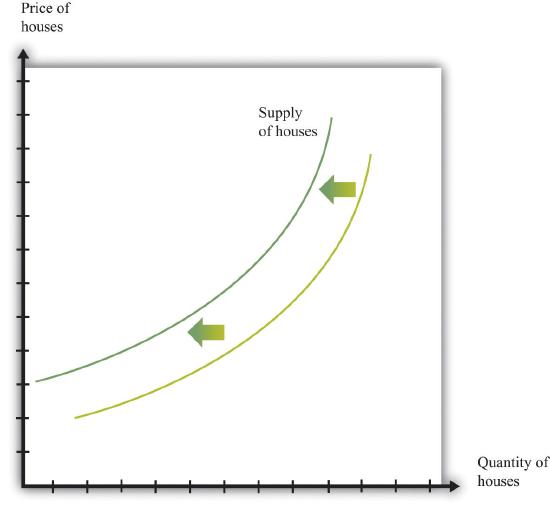
When we draw a supply curve, we again vary the price but hold everything else fixed. A change in any other factor will cause the market supply curve to shift. A leftward shift of the market supply curve for houses, as indicated in Figure 19.2.4 "A Shift in Supply of Houses", could be caused by many factors, including the following:
Increases in the costs of production, such as wages, the cost of borrowing, or the price of oil
Bad weather that delays or damages construction in process
Changes in regulations that make it harder to build
Figure \(\PageIndex{4}\): A Shift in Supply of Houses
If there is a decrease in supply of houses, then fewer houses are supplied at each price. The supply curve shifts leftward.
Market Equilibrium: What Determines the Price of Housing?
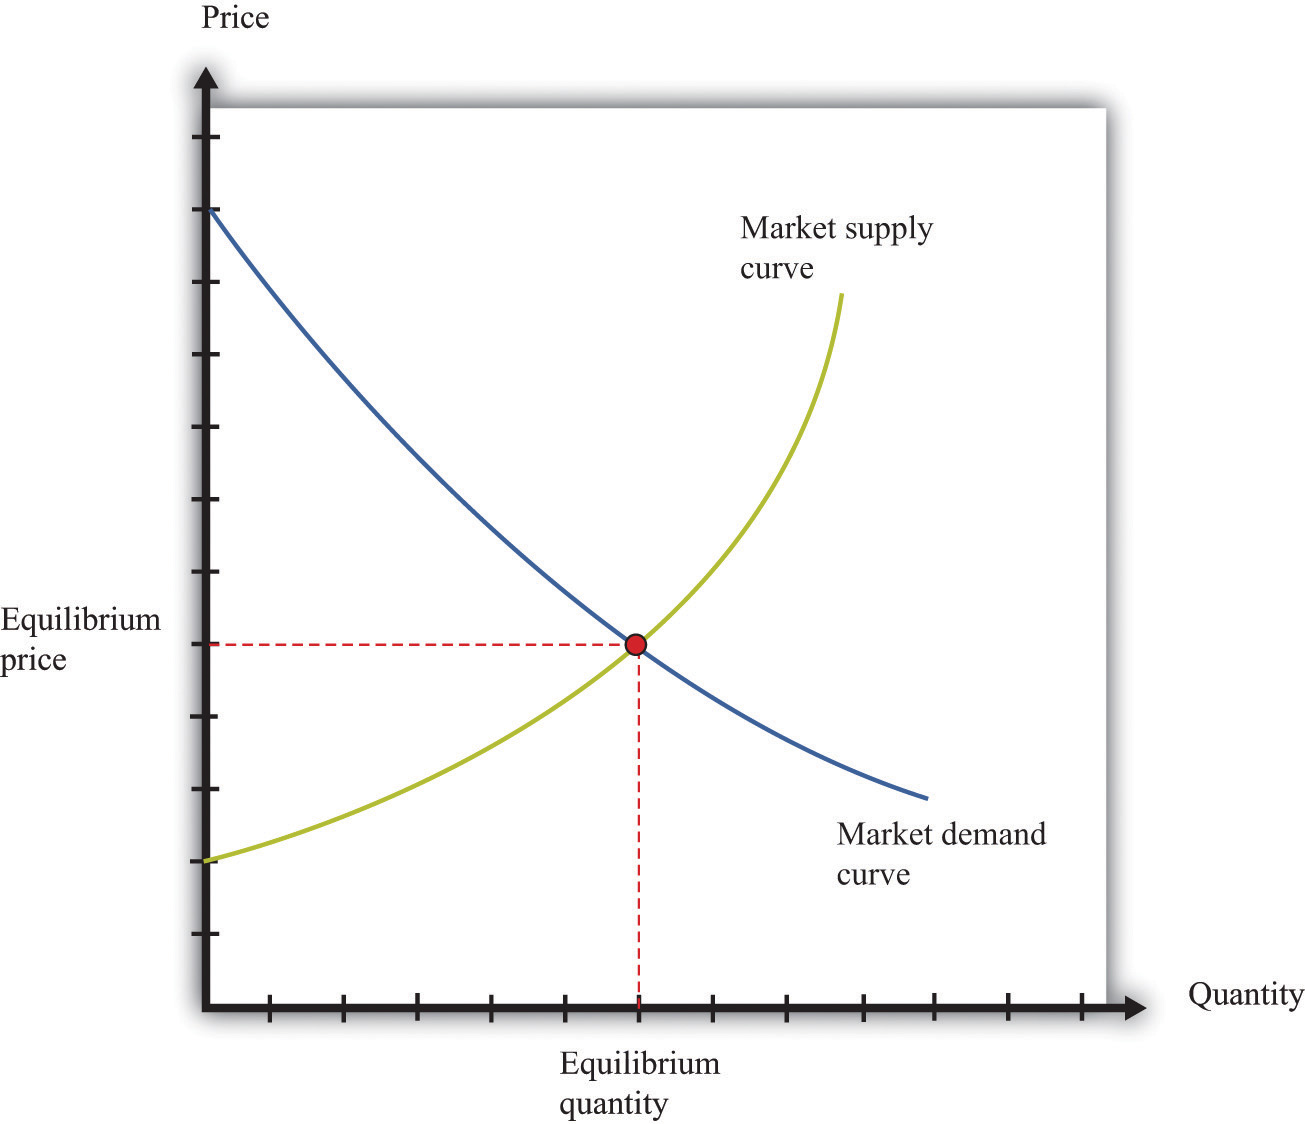
We now put the market demand and market supply curves together to give us the supply-and-demand picture in Figure 19.2.5 "Market Equilibrium". The point where supply and demand meet is the equilibrium in the market. At this point, there is a perfect match between the amount that buyers want to buy and the amount that sellers want to sell.
Toolkit: Section 31.9 "Supply and Demand"
Equilibrium in a market refers to an equilibrium price and an equilibrium quantity and has the following features:
Given the equilibrium price, sellers supply the equilibrium quantity.
Given the equilibrium price, buyers demand the equilibrium quantity.
Figure \(\PageIndex{5}\): Market Equilibrium
In a competitive market, equilibrium price and quantity are determined by the intersection of the supply and demand curves.
We speak of equilibrium because there is a balancing of the forces of supply and demand in the market. At the equilibrium price, suppliers of the good can sell as much as they wish, and demanders of the good can buy as much of the good as they wish. There are no disappointed buyers or sellers. Because the demand curve has a negative slope and the supply curve has a positive slope, supply and demand will cross once, and both equilibrium price and equilibrium quantity will be positive.
Table 19.2.1 "Market Equilibrium: An Example" provides an example of market equilibrium. It gives market supply and market demand for four different prices. Equilibrium occurs at a price of $100,000 and a quantity of 50 new houses.
Price ($)
Market Supply
Market Demand
10,000
5
95
50,000
25
75
100,000
50
50
200,000
100
0
Table \(\PageIndex{1}\): Market Equilibrium: An Example
Economists typically believe that a perfectly competitive market is likely to reach equilibrium. The reasons for this belief are as follows:
If price is different from the equilibrium price, then there will be an imbalance between demand and supply. This gives buyers and sellers an incentive to behave differently. For example, if price is less than the equilibrium price, demand will exceed supply. Disappointed buyers might start bidding up the price, or sellers might realize they could charge a higher price. The opposite is true if the price is too high: suppliers might be tempted to try cutting prices, while buyers might look for better deals.
There is strong support for market predictions in the evidence from experimental markets. When buyers and sellers meet individually and bargain over prices, we typically see an outcome very similar to the market outcome in Figure 19.2.5 "Market Equilibrium".
The supply-and-demand framework generally provides reliable predictions about the movement of prices.
Pictures like Figure 19.2.5 "Market Equilibrium" are useful to help understand how the market works. Keep in mind, however, that firms and households in the market do not need any of this information. This is one of the beauties of the market. All an individual firm or household needs to know is the prevailing market price. All the coordination occurs through the workings of the market.
Key Takeaways
The primary factor influencing demand for housing is the price of housing. By the law of demand, as price decreases, the quantity of housing demanded increases. The demand for housing also depends on the wealth of households, their current income, and interest rates.
The primary factor influencing supply of housing is the price of housing. As price increases, the quantity supplied also increases. The supply of housing is shifted by changes in the price of inputs and changes in technology.
The quantity and price of housing traded is determined by the equilibrium of the housing market.
Exercises
What would be the impact of a decrease in the cost of borrowing on the market supply curve of housing? What would be the impact of a decrease in the cost of borrowing on the market demand curve?
Name two events that would cause the housing market supply curve to shift rightward. Name two events that would cause the housing market demand curve to shift rightward.