The underpinnings of economic growth are investments in physical capital, human capital, and technology, all set in an economic environment where firms and individuals can react to the incentives provided by well-functioning markets and flexible prices. Government borrowing can reduce the financial capital available for private firms to invest in physical capital. But government spending can also encourage certain elements of long-term growth, such as spending on roads or water systems, on education, or on research and development that creates new technology.
Crowding Out Physical Capital Investment
A larger budget deficit will increase demand for financial capital. If private saving and the trade balance remain the same, then less financial capital will be available for private investment inphysical capital. When government borrowing soaks up available financial capital and leaves less for private investment in physical capital, the result is known ascrowding out.
To understand the potential impact of crowding out, consider the situation of the U.S. economy before the exceptional circumstances of the recession that started in late 2007. In 2005, for example, the budget deficit was roughly 4% of GDP. Private investment by firms in the U.S. economy has hovered in the range of 14% to 18% of GDP in recent decades. However, in any given year, roughly half of U.S. investment in physical capital just replaces machinery and equipment that has worn out or become technologically obsolete. Only about half represents an increase in the total quantity of physical capital in the economy. So investment in new physical capital in any year is about 7% to 9% of GDP. In this situation, even U.S. budget deficits in the range of 4% of GDP can potentially crowd out a substantial share of new investment spending. Conversely, a smaller budget deficit (or an increased budget surplus) increases the pool of financial capital available for private investment.
Note
Visit this website to view the “U.S. Debt Clock.”
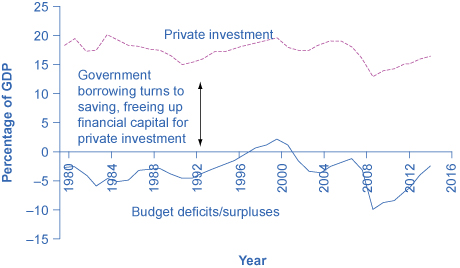
The patterns of U.S. budget deficits and private investment since 1980 are shown in Figure 1. If greater government deficits lead to less private investment in physical capital, and reduced government deficits or budget surpluses lead to more investment in physical capital, these two lines should move up and down at the same time. This pattern occurred in the late 1990s and early 2000s. The U.S. federal budget went from a deficit of 2.2% of GDP in 1995 to a budget surplus of 2.4% of GDP in 2000—a swing of 4.6% of GDP. From 1995 to 2000, private investment in physical capital rose from 15% to 18% of GDP—a rise of 3% of GDP. Then, when the U.S. government again started running budget deficits in the early 2000s, less financial capital became available for private investment, and the rate of private investment fell back to about 15% of GDP by 2003.
U.S. Budget Deficits/Surpluses and Private Investment
This argument does not claim that a government's budget deficits will exactly shadow its national rate of private investment; after all, private saving and inflows of foreign financial investment must also be taken into account. In the mid-1980s, for example, government budget deficits increased substantially without a corresponding drop off in private investment. In 2009, nonresidential private fixed investment dropped by $300 billion from its previous level of $1,941 billion in 2008, primarily because, during a recession, firms lack both the funds and the incentive to invest. Investment growth between 2009 and 2014 averaged approximately 5.9% to $2,210.5 billion—only slightly above its 2008 level, according to the Bureau of Economic Analysis. During that same period, interest rates dropped from 3.94% to less than a quarter percent as the Federal Reserve took dramatic action to prevent a depression by increasing the money supply through lowering short-term interest rates. The "crowding out" of private investment due to government borrowing to finance expenditures appears to have been suspended during the Great Recession. However, as the economy improves and interest rates rise, borrowing by the government may potentially create pressure on interest rates.
The Interest Rate Connection
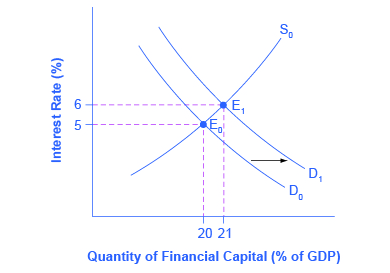
Assume that government borrowing of substantial amounts will have an effect on the quantity of private investment. How will this affect interest rates in financial markets? In Figure 2, the original equilibrium (E0) where thedemand curve (D0) for financial capital intersects with the supply curve (S0) occurs at an interest rate of 5% and an equilibrium quantity equal to 20% of GDP. However, as the government budget deficit increases, the demand curve for financial capital shifts from D0 to D1. The new equilibrium (E1) occurs at an interest rate of 6% and an equilibrium quantity of 21% of GDP.
Budget Deficits and Interest Rates
Figure 2: In the financial market, an increase in government borrowing can shift the demand curve for financial capital to the right from D0 to D1. As the equilibrium interest rate shifts from E0 to E1, the interest rate rises from 5% to 6% in this example. The higher interest rate is one economic mechanism by which government borrowing can crowd out private investment.
A survey of economic studies on the connection between government borrowing and interest rates in the U.S. economy suggests that an increase of 1% in the budget deficit will lead to a rise in interest rates of between 0.5 and 1.0%, other factors held equal. In turn, a higher interest rate tends to discourage firms from making physical capital investments. One reason government budget deficits crowd out private investment, therefore, is the increase in interest rates. There are, however, economic studies that show a limited connection between the two (at least in the United States), but as the budget deficit grows, the dangers of rising interest rates become more real.
At this point, you may wonder about the Federal Reserve. After all, can the Federal Reserve not use expansionary monetary policy to reduce interest rates, or in this case, to prevent interest rates from rising? This useful question emphasizes the importance of considering how fiscal and monetary policies work in relation to each other. Imagine a central bank faced with a government that is running large budget deficits, causing a rise in interest rates and crowding out private investment. If the budget deficits are increasing aggregate demand when the economy is already producing near potential GDP, threatening an inflationary increase in price levels, the central bank may react with acontractionary monetary policy. In this situation, the higher interest rates from the government borrowing would be made even higher by contractionary monetary policy, and the government borrowing might crowd out a great deal of private investment.
On the other hand, if the budget deficits are increasing aggregate demand when the economy is producing substantially less than potential GDP, an inflationary increase in the price level is not much of a danger and the central bank might react with expansionary monetary policy. In this situation, higher interest rates from government borrowing would be largely offset by lower interest rates from expansionary monetary policy, and there would be little crowding out of private investment.
However, even a central bank cannot erase the overall message of the national savings and investment identity. If government borrowing rises, then private investment must fall, or private saving must rise, or the trade deficit must fall. By reacting with contractionary or expansionary monetary policy, the central bank can only help to determine which of these outcomes is likely.
Public Investment in Physical Capital
Government can invest in physical capital directly: roads and bridges; water supply and sewers; seaports and airports; schools and hospitals; plants that generate electricity, like hydroelectric dams or windmills; telecommunications facilities; and weapons used by the military. In 2014, the U.S. federal government budget for Fiscal Year 2014 shows that the United States spent about $92 billion on transportation, including highways, mass transit, and airports. Table 1 shows the total outlay for 2014 for major public physical capital investment by the federal government in the United States. Physical capital related to the military or to residences where people live is omitted from this table, because the focus here is on public investments that have a direct effect on raising output in the private sector.
Type of Public Physical Capital
Federal Outlays 2014 ($ millions)
Transportation
$91,915
Community and regional development
$20,670
Natural resources and the environment
$36,171
Education, training, employment, and social services
$90,615
Other
$37,282
Total
$276,653
Table 1: Grants for Major Physical Capital Investment, 2014
Public physical capital investment of this sort can increase the output and productivity of the economy. An economy with reliable roads and electricity will be able to produce more. But it is hard to quantify how much government investment in physical capital will benefit the economy, because government responds to political as well as economic incentives. When a firm makes an investment in physical capital, it is subject to the discipline of the market: If it does not receive a positive return on investment, the firm may lose money or even go out of business.
In some cases, lawmakers make investments in physical capital as a way of spending money in the districts of key politicians. The result may be unnecessary roads or office buildings. Even if a project is useful and necessary, it might be done in a way that is excessively costly, because local contractors who make campaign contributions to politicians appreciate the extra business. On the other hand, governments sometimes do not make the investments they should because a decision to spend on infrastructure does not need to just make economic sense; it must be politically popular as well. Managing public investment so that it is done in a cost-effective way can be difficult.
If a government decides to finance an investment in public physical capital with higher taxes or lower government spending in other areas, it need not worry that it is directly crowding out private investment. Indirectly however, higher household taxes could cut down on the level of private savings available and have a similar effect. If a government decides to finance an investment in public physical capital by borrowing, it may end up increasing the quantity of public physical capital at the cost of crowding out investment in private physical capital, which is more beneficial to the economy would be dependent on the project being considered.
Public Investment in Human Capital
In most countries, the government plays a large role in society's investment in human capital through the education system. A highly educated and skilled workforce contributes to a higher rate of economic growth. For the low-income nations of the world, additional investment in human capital seems likely to increase productivity and growth. For the United States, tough questions have been raised about how much increases in government spending on education will improve the actual level of education.
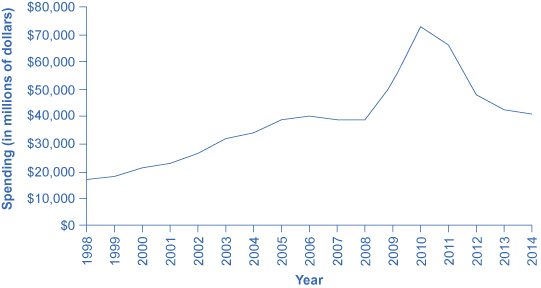
Among economists, discussions of education reform often begin with some uncomfortable facts. As shown in Figure 3, spending per student for kindergarten through grade 12 (K–12) increased substantially in real dollars through 2010. The U.S. Census Bureau reports that current spending per pupil for elementary and secondary education rose from $5,001 in 1998 to $10,608 in 2012. However, as measured by standardized tests like the SAT, the level of student academic achievement has barely budged in recent decades. Indeed, on international tests, U.S. students lag behind students from many other countries. (Of course, test scores are an imperfect measure of education for a variety of reasons. It would be difficult, however, to argue that there are not real problems in the U.S. education system and that the tests are just inaccurate.)
Total Spending for Elementary, Secondary, and Vocational Education (1998–2014) in the United States
Figure 3: The graph shows that government spending on education was continually increasing up until 2006 where it leveled off until 2008 when it increased dramatically. Since 2010, spending has steadily decreased. (Source: Office of Management and Budget)
The fact that increased financial resources have not brought greater measurable gains in student performance has led some education experts to question whether the problems may be due to structure, not just to the resources spent.
Other government programs seek to increase human capital either before or after the K–12 education system. Programs for early childhood education, like the federal Head Start program, are directed at families where the parents may have limited educational and financial resources. Government also offers substantial support for universities and colleges. For example, in the United States about 60% of students take at least a few college or university classes beyond the high school level. In Germany and Japan, about half of all students take classes beyond the comparable high school level. In the countries of Latin America, only about one student in four takes classes beyond the high school level, and in the nations of sub-Saharan Africa, only about one student in 20.
Not all spending on educationalhuman capital needs to happen through the government: many college students in the United States pay a substantial share of the cost of their education. If low-income countries of the world are going to experience a widespread increase in their education levels for grade-school children, government spending seems likely to play a substantial role. For the U.S. economy, and for other high-income countries, the primary focus at this time is more on how to get a bigger return from existing spending on education and how to improve the performance of the average high school graduate, rather than dramatic increases in education spending.
How Fiscal Policy Can Improve Technology
Research and development (R&D) efforts are the lifeblood of new technology. According to the National Science Foundation, federal outlays for research, development, and physical plant improvements to various governmental agencies have remained at an average of 8.8% of GDP. About one-fifth of U.S. R&D spending goes to defense and space-oriented research. Although defense-oriented R&D spending may sometimes produce consumer-oriented spinoffs, R&D that is aimed at producing new weapons is less likely to benefit the civilian economy than direct civilian R&D spending.
Fiscal policy can encourage R&D using either direct spending or tax policy. Government could spend more on the R&D that is carried out in government laboratories, as well as expanding federal R&D grants to universities and colleges, nonprofit organizations, and the private sector. By 2014, the federal share of R&D outlays totaled $135.5 billion, or about 4% of the federal government's total budget outlays, according to data from the National Science Foundation. Fiscal policy can also support R&D through tax incentives, which allow firms to reduce their tax bill as they increase spending on research and development.
Summary of Fiscal Policy, Investment, and Economic Growth
Investment in physical capital, human capital, and new technology is essential for long-term economic growth, as summarized in Table 2. In a market-oriented economy, private firms will undertake most of the investment in physical capital, and fiscal policy should seek to avoid a long series of outsized budget deficits that might crowd out such investment. The effects of many growth-oriented policies will be seen very gradually over time, as students are better educated, physical capital investments are made, and new technologies are invented and implemented.
Physical Capital
Human Capital
New Technology
Private Sector
New investment in property and equipment
On-the-job training
Research and development
Public Sector
Public infrastructure
Public education Job training
Research and development encouraged through private sector incentives and direct spending.
Table 2: Investment Role of Public and Private Sector in a Market Economy
Key Concepts and Summary
Economic growth comes from a combination of investment in physical capital, human capital, and technology. Government borrowing can crowd out private sector investment in physical capital, but fiscal policy can also increase investment in publicly owned physical capital, human capital (education), and research and development. Possible methods for improving education and society’s investment in human capital include spending more money on teachers and other educational resources, and reorganizing the education system to provide greater incentives for success. Methods for increasing research and development spending to generate new technology include direct government spending on R&D and tax incentives for businesses to conduct additional R&D.
References
U.S. Department of Commerce: Bureau of Economic Analysis. “National Data: National Income and Product Accounts Tables.” Accessed December 1, 2013. www.bea.gov/iTable/iTable.cfm...905=2013&906=A.
The White House. “Fiscal Year 2013 Historical Tables: Budget of the U.S. Government.” Accessed December 12, 2013. www.whitehouse.gov/sites/defa...ssets/hist.pdf.
The National Science Foundation. Accessed December 19, 2013. http://www.nsf.gov/.
Glossary
Head Start program
a program for early childhood education directed at families with limited educational and financial resources.