The positive relationship between economic performance and standards of living motivates the study of macroeconomics and macroeconomic policy. The ideal would be an economy in which, starting with full employment of labour and capital equipment, the rate of growth of real GDP matched the rate of growth of the labour force and growth in labour productivity, at a low and stable rate of inflation. This is sometimes referred to as a 'Goldilocks Economy' – neither too hot nor too cold, just right.
Figures 4.1 to 4.4 provide a more detailed look at the actual rate of growth of real GDP, the rate of inflation, and unemployment rate in Canada over the 2000–2016 time period. They show the trends and annual variations in these measures of economic performance. Understanding the causes of these short-term fluctuations in economic performance, their effects on standards of living and the economic policy questions they raise, are major reasons for studying macroeconomics.
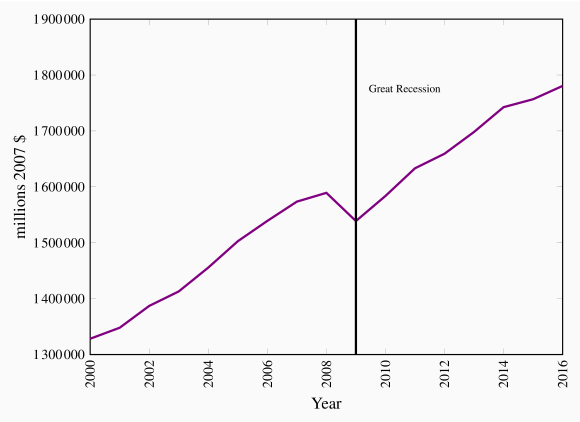
Figure 4.1 shows the substantial growth in real GDP over the 2000–2016 period. It also shows that growth was not steady. Real GDP did increase from 2000–2008 with annual growth rates ranging from 1.5-3.0. Then the real GDP declined sharply by 3.0 percent in 2009. This and other times of negative growth in real GDP are called recessions. Indeed the fall in real GDP in 2009, the largest such decline since the 1930s, is now called the 'Great Recession'.
Recession: decline in economic activity, often defined as two consecutive quarters of negative growth in real GDP.
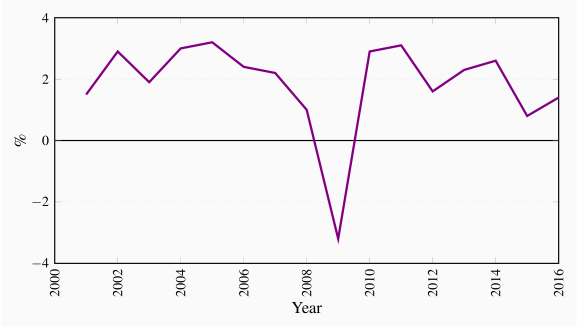
Figure 4.2 shows more clearly the considerable fluctuations in real GDP annual growth rates and the negative growth rate of the Great Recession. Even when the trend in growth is positive, fluctuations in growth rates can have negative effects on standards of living. They are reflected in changes in employment, changes in incomes and changes in markets that can make life difficult for those affected. We study macroeconomics to find explanations for the causes and effects of these fluctuations in economic activity that will guide stabilization policies.
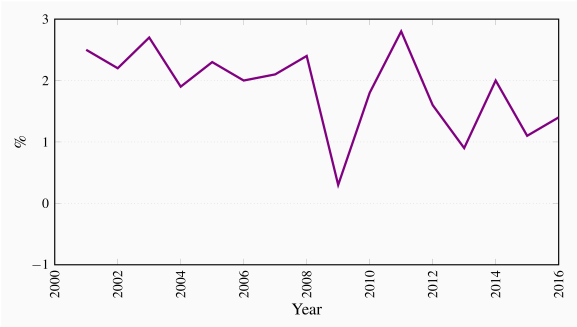
Figure 4.3 shows annual inflation rates in Canada since 2000. These show the relative stability of Canadian inflation in the years leading up to the Great Recession. That pattern changed after 2008 with the effects of lower output growth and higher unemployment on prices and wage rates.
Our recent experience with low and stable inflation rates in the 2000–2016 period is quite different from past experience. In the late 1980s and early 1990s annual inflation rates were at times higher than 10 percent. We will examine the roles that monetary policies and recessions played in these changes in inflation rates.
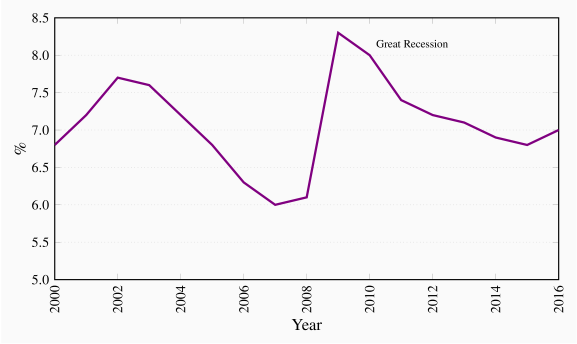
Fluctuations in growth rates and inflation rates are also accompanied by fluctuations in unemployment rates. Annual unemployment rates plotted in Figure 4.4 have fluctuated between 6 percent and 8.3 percent. Although employment has grown over time, when job creation has at times fallen short of the growth in the labour force, unemployment rates rise. At other times, strong real GDP growth and job creation have lowered the unemployment rate. The falling unemployment rates from 2002 to 2007 and again from 2009 to 2015 coincided in time with the continuous growth in real GDP we saw in Figure 4.1.
The sharp rise in unemployment in 2009 and the persistence of unemployment rates higher than those in earlier years give us an example of the way growth in real GDP and employment are tied together. The recovery of GDP growth after the Great Recession has not been strong enough to offset modest growth in the labour force and lower unemployment rates to pre-recession levels.