Social Sci LibreTexts

6.6: Exercises for Chapter 6

  • Page ID
    45768
  • \( \newcommand{\vecs}[1]{\overset { \scriptstyle \rightharpoonup} {\mathbf{#1}} } \) \( \newcommand{\vecd}[1]{\overset{-\!-\!\rightharpoonup}{\vphantom{a}\smash {#1}}} \)\(\newcommand{\id}{\mathrm{id}}\) \( \newcommand{\Span}{\mathrm{span}}\) \( \newcommand{\kernel}{\mathrm{null}\,}\) \( \newcommand{\range}{\mathrm{range}\,}\) \( \newcommand{\RealPart}{\mathrm{Re}}\) \( \newcommand{\ImaginaryPart}{\mathrm{Im}}\) \( \newcommand{\Argument}{\mathrm{Arg}}\) \( \newcommand{\norm}[1]{\| #1 \|}\) \( \newcommand{\inner}[2]{\langle #1, #2 \rangle}\) \( \newcommand{\Span}{\mathrm{span}}\) \(\newcommand{\id}{\mathrm{id}}\) \( \newcommand{\Span}{\mathrm{span}}\) \( \newcommand{\kernel}{\mathrm{null}\,}\) \( \newcommand{\range}{\mathrm{range}\,}\) \( \newcommand{\RealPart}{\mathrm{Re}}\) \( \newcommand{\ImaginaryPart}{\mathrm{Im}}\) \( \newcommand{\Argument}{\mathrm{Arg}}\) \( \newcommand{\norm}[1]{\| #1 \|}\) \( \newcommand{\inner}[2]{\langle #1, #2 \rangle}\) \( \newcommand{\Span}{\mathrm{span}}\)\(\newcommand{\AA}{\unicode[.8,0]{x212B}}\)

    EXERCISE 6.1

    Suppose that in an economy with no government the aggregate expenditure function is: img253.png.

    1. Draw a diagram showing the aggregate expenditure function, and indicate the level of planned expenditure when income is 150.
    2. In this same diagram, show what would happen to aggregate expenditure if income increased to 200.
    3. What are the levels of autonomous expenditure and induced expenditure at income levels of 150 and 200.
    4. In this same diagram show what would happen if autonomous expenditure increased by 20.
    EXERCISE 6.2

    Suppose the media predicts a deep and persistent economic recession. Households expect their future income and employment prospects to fall. They cut back on expenditure, reducing autonomous expenditure from 50 to 30.

    1. Re-draw the aggregate expenditure functions you have drawn in your diagrams for Exercise 6.1 to show the effects, if any, of this change in household behaviour.
    2. Suppose the negative economic forecast also reduces induced expenditure in the economy from 0.75Y to 0.5Y. In a diagram show the effect would this have on the aggregate expenditure functions you have drawn.
    EXERCISE 6.3

    Construct a table showing autonomous, induced and aggregate expenditure at different income levels (Y) for an economy with autonomous expenditure of 105 and induced expenditure of 0.5Y.

    1. Using numbers from your table draw a diagram showing the aggregate expenditure function AE. What is the intercept of this function on the vertical axis?
    2. What is the slope of the AE function, and what does the slope measure?
    3. Write the equation for the aggregate expenditure function for this economy.
    EXERCISE 6.4

    Output and income are in equilibrium when planned expenditures AE are equal to national income, Y, in other words, meaning img266.png.

    1. Suppose the AE function is img267.png. Draw a diagram showing the aggregate expenditure function.
    2. In your diagram draw the img268.png line that shows all points at which national income and aggregate expenditures are equal (img269.png).
    3. Using your diagram, or a numerical example, or an algebraic solution, find equilibrium output and income in this example and show it in the diagram.
    EXERCISE 6.5

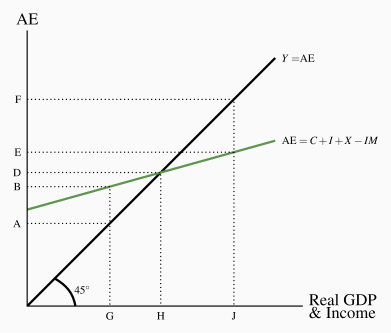
    The diagram below shows the aggregate expenditure schedule for the economy and the equilibrium condition on the img274.png line.

    img275.png

    1. Suppose output is 0G. What is the level of planned aggregate expenditure? Is planned expenditure greater or less than output?
    2. What is the size of the unplanned change in inventories at output 0G?
    3. How will business firms respond to this situation?
    4. What is the equilibrium income and expenditure?
    5. Suppose output is at 0J: What is there an unplanned change in inventories?
    EXERCISE 6.6

    The following diagram shows an economy that initially has an aggregate expenditure function AK.

    img276.png

    1. What is the initial equilibrium real GDP?
    2. Suppose there is an increase in the marginal propensity to import. What is the new aggregate expenditure function?
    3. What is the new equilibrium real GDP and income?
    4. Suppose, instead, the marginal propensity to consume has increased. What is the new aggregate expenditure function? What is the new equilibrium real GDP and income?
    EXERCISE 6.7

    The distinction between autonomous and induced expenditure is important for the determination of equilibrium real GDP. Assume that the marginal propensity spend on domestic output is 0.70 and autonomous aggregate expenditure is zero.

    1. What is the equation for the aggregate expenditure function under these assumptions?
    2. Draw the aggregate expenditure function in an income-expenditure img277.png line diagram.
    3. What is the equilibrium level of real GDP illustrated by your diagram?
    4. Explain why this is the equilibrium level of real GDP.
    EXERCISE 6.8

    Suppose the slope of the AE function is 0.6. Starting from equilibrium, suppose planned investment increases by 10.

    1. By how much and in what direction does equilibrium income change?
    2. How much of that change in equilibrium income is the result of the change in induced expenditure?
    3. How would your answers to (b) differ if the slope of the AE function was 0.8?
    EXERCISE 6.9

    Suppose autonomous expenditure is 100 and there is no induced expenditure in the economy.

    1. Write the aggregate expenditure function for this economy.
    2. Draw the aggregate expenditure function and the img285.png line in a diagram.
    3. What is the equilibrium level of real output and income?
    4. By how much would equilibrium real output change if autonomous expenditure increased to 125? Show the change in expenditure and equilibrium in your diagram for part (b).
    5. What is the size of the multiplier? Explain your answer.

    This page titled 6.6: Exercises for Chapter 6 is shared under a CC BY-NC-SA license and was authored, remixed, and/or curated by Douglas Curtis and Ian Irvine (Lyryx) .

    • Was this article helpful?