Recall, from Chapter 4, that the growth rate of a variable is its percentage change over time. To define economic growth we must specify both the variable to measure and the period over which to measure it. Percentage changes in real GDP and real GDP per person over periods of one year are used to measure annual rates of economic growth.
Economic growth: the annual percentage change in real GDP or per capita real GDP.
Annual real GDP measures the total output of final goods and services in the economy for one-year periods. As a result, the annual rate of growth in real GDP is the change in the size of the total economy. But, as discussed in Chapter 4, increases in the size of the total economy may not reflect changes in standards of living or economic welfare. To get an indication of how these grow, stagnate or decline we need to look at growth in real GDP per person. Growth in real GDP can raise standards of living only if it exceeds the growth in population, providing, on average, more goods and services to the average individual.
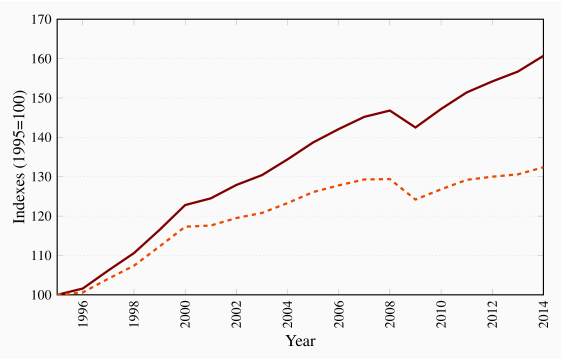
Figure 13.1 illustrates the growth of real GDP and real GDP per capita in Canada from 1995 to 2014. In that time frame the index of real GDP, with 1995 as the base year, increased by about 45 percent from 1995 until the financial crisis of 2008, then declined during the 'Great Recession' before resuming growth in 2010. Over the full 1995–2014 period real GDP grew by 60 percent.
Population in Canada was also growing in the 1995–2014 period. As a result the growth in per capita real GDP was less than in real GDP. Figure 13.1 shows that growth in real GDP per capita grew by about 32 percent over the 1995–2014 period. This is a rough measure of the improvement in standard of living for the average Canadian over that time. But there are questions about the distribution of the changes in standard of living.
Structural change in economic output and employment are an integral part of economic growth. In industrial economies evolving supply and demand conditions lead to higher rates of growth in service sector output and employment relative to the goods sector. Different underlying trends in investment in physical and human capital, technology and entrepreneurial experience by sector, together with differences in sector income and price elasticities of demand explain the longer term evolution of output structures. Table 4.2 showed that in Canada by 2016 the service sector produced 70 percent of real GDP and the goods sector approximately 30 percent.
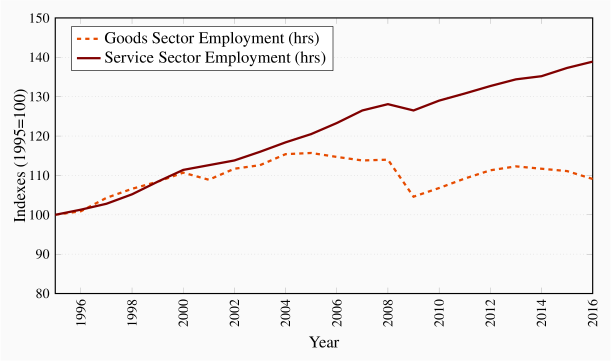
Structural changes leading to this distribution of output have also had important effects on employment by sector in Canada. Different sector rates of investment and change in technology have resulted in slower rates of employment growth in the goods producing sector. Figure 13.2 uses indexes of employment to show the Canadian experience. From 1995 to 2004 goods sector employment increased by about 15 percent and service sector employment by about 18 percent. After that, from 2004 to 2016, goods sector employment fell by about 6 percent. However, service sector employment increased by 18 percent. As a result employment in the goods producing sector fell from about 29 per cent of total employment in 1995 to about 24 per cent in 2016. These changes have implications for the future growth in output, employment, real incomes and the ways in which the per capital real income gains from growth are shared.
Differences in growth rates
Another interesting aspect of growth in real GDP or any other variable is the importance of small differences in compound annual growth rates on growth paths over time. Table 13.1 provides an illustration for selected time periods from one year to 40 years. Annual growth rates in the range of about 0.5% to 4.0% in real GDP and per capita real GDP are common among industrialized countries.
Table 13.1 Importance of small differences in annual growth rates
| Growth Rate |
0.5% |
1.0% |
2.0% |
3.0% |
3.5% |
4.0% |
| Initial value |
100 |
100 |
100 |
100 |
100 |
100 |
| Year 1 |
100.5 |
101.0 |
102.0 |
103.0 |
103.5 |
104 |
| Year 5 |
102.5 |
105.1 |
110.4 |
115.9 |
118.8 |
121.7 |
| Year 10 |
105.1 |
110.5 |
121.9 |
134.4 |
141.5 |
148.0 |
| Year 20 |
110.5 |
122.0 |
148.6 |
180.6 |
199.0 |
219.1 |
| Year 40 |
122.1 |
148.9 |
220.8 |
326.2 |
395.9 |
480.1 |
Over a twenty year period an annual growth rate of 2.0 percent would increase per capita real GDP by almost 50 percent, a growth rate of 3.0 percent would increase it by 80 percent and a growth rate of 3.5 percent would double it. Even over a shorter period like the Great Recession and recovery of 2007–2012, a drop in the average annual growth rate from 3.0 percent to 1.0 percent would mean a GDP 10 percent lower than it would have been under steady 3.0 percent growth.
Table 13.2 illustrates the actual variations in growth rates of per capita real GDP across selected industrial economies from 1995 to 2014. Differences in growth rates in 1995–2001 were relatively small and in the range of 2.3 percent and 3.5 percent for most countries in this sample, except for Japan and Korea with rates of 0.5 percent and 4.6 percent respectively. The standard of living was catching up with those in other countries while that in Japan was roughly constant. Except for Japan, all these growth rates by country declined in the next two time periods reported, with particularly large declines as a result of the international financial crisis and recession after 2008. The underlying causes of this slowdown in growth will be examined in terms of a basic theory of economic growth.
Table 13.2 Growth rates in per capita real GDP: Selected countries
| |
(Average annual % change) |
| |
1995–2001 |
2002–2008 |
2009–2014 |
| Australia |
2.7 |
1.9 |
0.9 |
| Canada |
2.7 |
1.6 |
0.5 |
| France |
2.3 |
1.1 |
-0.1 |
| Greece |
3.3 |
3.8 |
-4.5 |
| Japan |
0.5 |
1.5 |
0.5 |
| Korea |
4.6 |
4.5 |
2.7 |
| Spain |
3.5 |
1.7 |
-1.2 |
| Sweden |
3.1 |
2.8 |
0.3 |
| United Kingdom |
2.7 |
2.4 |
-0.1 |
| United States |
2.6 |
1.7 |
0.5 |
Source: International Monetary Fund, World Economic Outlook Database, October 2015, and authors' calculations.