The demand curve describes how either one consumer or a group of consumers would change the amount they would purchase if the price were to change. Producers may also adjust the amounts they sell if the market price changes.
Recall from Chapter 2 the principle that a firm should operate in the short run if they can achieve an economic profit; otherwise the firm should shut down in the short run. If the firm decides it is profitable to operate, another principle from Chapter 2 stated that the firm should increase production up to the level where marginal cost equals marginal revenue.
In the case of a flat demand curve, the marginal revenue to a firm is equal to the market price. Based on this principle, we can prescribe the best operating level for the firm in response to the market price as follows:
If the price is too low to earn an economic profit at any possible operating level, shut down.
If the price is higher than the marginal cost when production is at the maximum possible level in the short run, the firm should operate at that maximum level.
Otherwise, the firm should operate at the level where price is equal to marginal cost.
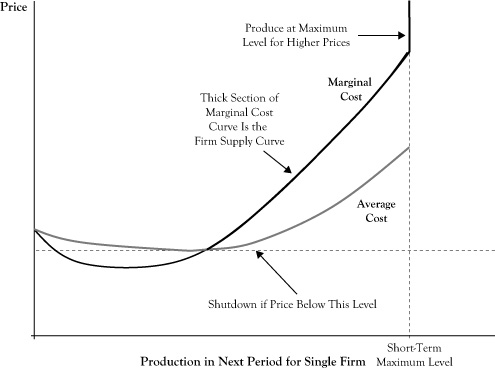
Figure 6.3 shows a generic situation with average (economic) cost and marginal cost curves. Based on the preceding rule, a relationship between the market price and the optimal quantity supplied is the segment of the marginal cost curve that is above the shutdown price level and where the marginal cost curve is increasing, up to the point of maximum production. For prices higher than the marginal cost at maximum production, the firm would operate at maximum production.
Figure 6.3 Relationship of Average Cost Curve, Marginal Cost Curve, and Firm Supply Curve for a Single Seller in a Perfectly Competitive Market
This curve segment provides an analogue to the demand curve to describe the best response of sellers to market prices and is called the firm supply curve. As is done with demand curves, the convention in economics is to place the quantity on the horizontal axis and price on the vertical axis. Note that although demand curves are typically downward sloping to reflect that consumers’ utility for a good diminishes with increased consumption, firm supply curves are generally upward sloping. The upward sloping character reflects that firms will be willing to increase production in response to a higher market price because the higher price may make additional production profitable. Due to differences in capacities and production technologies, seller firms may have different firm supply curves.
If we were to examine all firm supply curves to determine the total quantity that sellers would provide at any given price and determined the relationship between the total quantity provided and the market price, the result would be the market supply curve. As with firm supply curves, market supply curves are generally upward sloping and reflect both the willingness of firms to push production higher in relation to improved profitability and the willingness of some firms to come out of a short-run shutdown when the price improves sufficiently.