3.3: Demand and supply curves
- Page ID
- 108367

\( \newcommand{\vecs}[1]{\overset { \scriptstyle \rightharpoonup} {\mathbf{#1}} } \) \( \newcommand{\vecd}[1]{\overset{-\!-\!\rightharpoonup}{\vphantom{a}\smash {#1}}} \)\(\newcommand{\id}{\mathrm{id}}\) \( \newcommand{\Span}{\mathrm{span}}\) \( \newcommand{\kernel}{\mathrm{null}\,}\) \( \newcommand{\range}{\mathrm{range}\,}\) \( \newcommand{\RealPart}{\mathrm{Re}}\) \( \newcommand{\ImaginaryPart}{\mathrm{Im}}\) \( \newcommand{\Argument}{\mathrm{Arg}}\) \( \newcommand{\norm}[1]{\| #1 \|}\) \( \newcommand{\inner}[2]{\langle #1, #2 \rangle}\) \( \newcommand{\Span}{\mathrm{span}}\) \(\newcommand{\id}{\mathrm{id}}\) \( \newcommand{\Span}{\mathrm{span}}\) \( \newcommand{\kernel}{\mathrm{null}\,}\) \( \newcommand{\range}{\mathrm{range}\,}\) \( \newcommand{\RealPart}{\mathrm{Re}}\) \( \newcommand{\ImaginaryPart}{\mathrm{Im}}\) \( \newcommand{\Argument}{\mathrm{Arg}}\) \( \newcommand{\norm}[1]{\| #1 \|}\) \( \newcommand{\inner}[2]{\langle #1, #2 \rangle}\) \( \newcommand{\Span}{\mathrm{span}}\)\(\newcommand{\AA}{\unicode[.8,0]{x212B}}\)
Figure 3.1 Measuring price & quantity
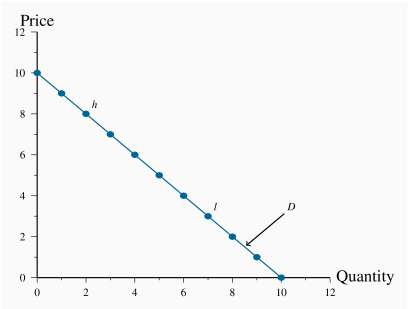
To derive this demand curve we take each price-quantity combination from the demand schedule in Table 3.1 and insert a point that corresponds to those combinations. For example, point h defines the combination ![]() , the point l denotes the combination
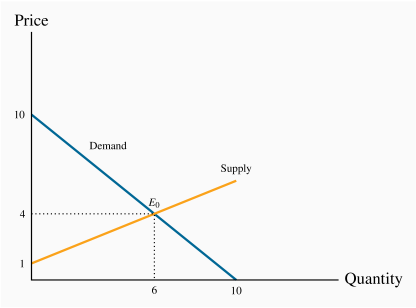
, the point l denotes the combination ![]() . If we join all such points we obtain the demand curve in Figure 3.2.The same process yields the supply curve in Figure 3.2. In this example the supply and the demand curves are each linear. There is no reason why this linear property characterizes demand and supply curves in the real world; they are frequently found to have curvature. But straight lines are easier to work with, so we continue with them for the moment.
. If we join all such points we obtain the demand curve in Figure 3.2.The same process yields the supply curve in Figure 3.2. In this example the supply and the demand curves are each linear. There is no reason why this linear property characterizes demand and supply curves in the real world; they are frequently found to have curvature. But straight lines are easier to work with, so we continue with them for the moment.
Figure 3.2 Supply, demand, equilibrium