Most prime-age individuals work, but some do not. The decision to join the labour force is called the participation decision. Of those who do participate in the labour force, some individuals work full time, others work part time, and yet others cannot find a job. The unemployment rate is the fraction of the labour force actively seeking employment that is not employed.
The participation rate for the economy is the fraction of the population in the working age group that joins the labour force.
The labour force is that part of the population either employed or seeking employment.
The unemployment rate is the fraction of the labour force actively seeking employment that is not employed.
Data on participation rates in Canada are given in Table 12.2 below for specific years in the modern era. The overall participation for men and women combined has increased since 1977 from 60.8% to 65.8% This aggregated rate camouflages different patterns for men and women. The rates for women have been rising while the rates for men have fallen. Women today are more highly educated, and their role in society and the economy is viewed very differently than in the earlier period. Female participation has increased both because of changing social norms, a rise in household productivity, the development of service industries designed to support home life, and the development of the institution of daycare for young children.
In contrast, male participation rates declined over the period, largely offsetting the increase in female participation. Fewer individuals in total are retiring before the age of 55 in the most recent decades. This reflects both the greater number of females in the market place, and perhaps also a recognition that many households have not saved enough to fund a retirement period that has become longer as a result of increased longevity.
Table 12.2 Labour force participation rate, Canada 1977-2015
| Year |
Total |
Men |
Women |
All > 55 |
Unemployment |
| 1977 |
60.8 |
80.2 |
42.1 |
30.5 |
5.9 |
| 1990 |
66.6 |
77.1 |
56.8 |
25.9 |
7.4 |
| 1994 |
65.4 |
74.9 |
56.8 |
24.5 |
9.2 |
| 2001 |
66.1 |
73.4 |
59.2 |
26.4 |
6.2 |
| 2008 |
67.5 |
73.6 |
61.6 |
34.2 |
5.1 |
| 2015 |
66.2 |
72.0 |
60.6 |
37.3 |
6.0 |
| 2019 |
65.8 |
71.0 |
60.8 |
38.0 |
4.4 |
Source: Statistics Canada, CANSIM 14-10-0287-02
September of each year, for individuals aged

25, unless stated.
At the micro level, the participation rate of individuals depends upon several factors. First, the wage rate that an individual can earn in the market is crucial. If that wage is low, then the individual may be more efficient in producing home services directly, rather than going into the labour market, earning a modest income and having to pay for home services. Second, there are fixed costs associated with working. A decision to work means that the individual must have work clothing, must undertake the costs of travel to work, and pay for daycare if there are children in the family. Third, the participation decision depends upon non-labour income. If the individual in question has a partner who earns a substantial amount, or if she has investment income, she will have less incentive to participate. Fourth, it depends inversely upon the tax rate.
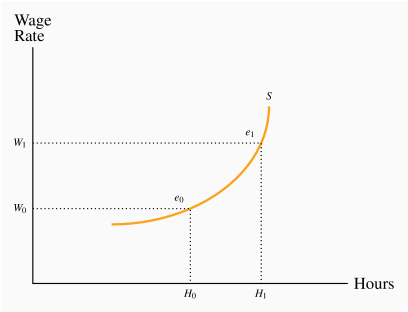
The supply curve relates the supply decision to the price of labour – the wage rate. Economists who have studied the labour market tell us that the individual supply curve is upward sloping: As the wage increases, the individual wishes to supply more labour. From the point  on the supply function in Figure 12.2, let the wage increase from
  to
to  .
.
The individual offers more labour,  , at the higher wage. What is the economic intuition behind the higher amount of labour supplied? Like much of choice theory there are two impacts associated with a higher price. First, the higher wage makes leisure more expensive relative to working. That midweek game of golf has become more expensive in terms of what the individual could earn. So the individual should substitute away from the more expensive 'good', leisure, towards labour. But at the same time, in order to generate a given income target the individual can work fewer hours at the higher wage. This is a type of income effect, indicating that income is greater at a higher wage regardless of the amount worked, and this induces the individual to work less. The fact that we draw the labour supply curve with a positive slope means that the substitution effect is the more important of the two. That is what statistical research has revealed.
Elasticity of the supply of labour
The value of the supply elasticity depends upon how the market in question is defined. In particular, it depends upon how large or small a given sector of the economy is, and whether we are considering the short run or the long run.
Suppose an industry is small relative to the whole economy and employs workers with common skills. These industries tend to pay the 'going wage'. For example, very many students are willing to work at the going rate for telemarketing firms, which compose a small sector of the economy. This means that the supply curve of such labour, as far as that sector is concerned, is in effect horizontal – infinitely elastic.
But some industries may not be small relative to the total labour supply. And in order to get more labour to work in such large sectors it may be necessary to provide the inducement of a higher wage: Additional workers may have to be attracted from another sector by means of higher wages. To illustrate: Consider the behaviour of two related sectors in housing – new construction and home restoration. In order to employ more plumbers and carpenters, new home builders may have to offer higher wages to induce them to move from the renovation sector. In this case the new housing industry's labour supply curve slopes upwards.
In the time dimension, a longer period is always associated with more flexibility. In this context, the supply of labour to any sector is more elastic, because it may take time for workers to move from one sector to another. Or, in cases where skills must be built up: When a sectoral expansion bids up the wages of information technology (IT) workers, more school leavers are likely to develop IT skills. Time will be required before additional graduates are produced, but in the long run, such additional supply will moderate the short-run wage increases.
Wages can be defined as being before-tax or after-tax. The after-tax, or take-home, wage is more important than the gross wage in determining the quantity of labour to be supplied. If taxes on additional hours of work are very high, workers are more likely to supply less hours than if tax rates are lower.