Despite the many good arguments favoring free or relatively free trade, we observe numerous trade barriers. These barriers come in several forms. A tariff is a tax on an imported product that is designed to limit trade and generate tax revenue. It is a barrier to trade. An import quota is a limitation on imports; other non-tariff barriers take the form of product content requirements, and subsidies. By raising the domestic price of imports, a tariff helps domestic producers but hurts domestic consumers. Quotas and other non-tariff barriers have similar impacts.
A tariff is a tax on an imported product that is designed to limit trade in addition to generating tax revenue.
A quota is a quantitative limit on an imported product.
A trade subsidy to a domestic manufacturer reduces the domestic cost and limits imports.
Non-tariff barriers, such as product content requirements, limit the gains from trade.
Application Box 15.2 Tariffs – the national policy of J.A. MacDonald
In Canada, tariffs were the main source of government revenues, both before and after Confederation in 1867 and up to World War I. They provided 'incidental protection' for domestic manufacturing. After the 1878 federal election, tariffs were an important part of the National Policy introduced by the government of Sir John A. MacDonald. The broad objective was to create a Canadian nation based on east-west trade and growth.
This National Policy had several dimensions. Initially, to support domestic manufacturing, it increased tariff protection on foreign manufactured goods, but lowered tariffs on raw materials and intermediate goods used in local manufacturing activity. The profitability of domestic manufacturing improved. But on a broader scale, tariff protection, railway promotion, Western settlement, harbour development, and transport subsidies to support the export of Canadian products were intended to support national economic development. Although reciprocity agreements with the United States removed duties on commodities for a time, tariff protection for manufactures was maintained until the GATT negotiations of the post-World War II era.
Tariffs
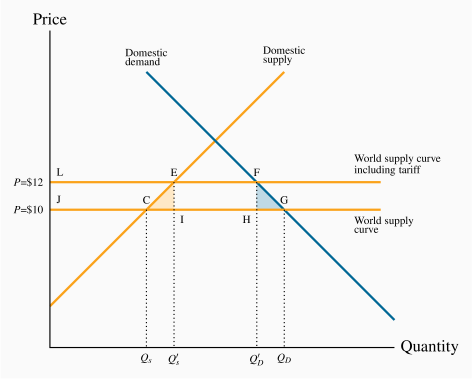
Figure 15.4 describes how tariffs operate. We can think of this as the Canadian wine market—a market that is heavily taxed in Canada. The world price of Cabernet Sauvignon is, let us say, $10 per bottle, and this is shown by the horizontal world supply curve at that price. To maintain simplicity, we will neglect any taxes on alcohol here other than the tax represented by the tariff. The international supply curve is horizontal because the domestic market accounts for only a small part of the world demand for wine: we are sufficiently small that international producers can supply us with any amount we wish to buy at the world price. The Canadian demand for this wine is given by the demand curve D, and Canadian suppliers have a supply curve given by S (Canadian Cabernet is assumed to be of the same quality as the imported variety in this example). The effective supply curve in the Canadian market is now BCM. At a price of $10, Canadian consumers wish to buy  litres, and domestic producers wish to supply
  litres. The gap between domestic supply and domestic demand is filled by imports. This is the free trade equilibrium.
If the government now imposes a 20 percent tariff on imported wines (or a $2 per bottle tax), foreign wine sells for $12 a bottle, inclusive of the tariff. The effective supply curve in the Canadian market becomes BEK. The tariff raises the domestic 'tariff-inclusive' price above the world price, and this shifts the international supply curve of this wine upwards. By raising wine prices in the domestic market, the tariff protects domestic producers by raising the domestic price at which imports become competitive. Those domestic suppliers who were previously not quite competitive at a global price of $10 are now competitive. The total quantity demanded falls from QD to  at the new equilibrium F. Domestic producers supply the amount
  and imports fall to the amount
  . Reduced imports are partly displaced by those domestic producers who can supply at prices between $10 and $12. Hence, imports fall both because total consumption falls and because domestic suppliers can displace some imports under the protective tariff; the amount
  .
.
Since the tariff is a type of tax, its impact in the market depends upon the elasticities of supply and demand, (as illustrated in Chapters 4 and 5). The more elastic is the demand curve, the more a given tariff reduces imports. In contrast, if it is inelastic the quantity of imports declines less.
Costs and benefits of a tariff
The costs of a tariff come from the higher price to consumers, but this is partly offset by the tariff revenue that goes to the government. This tariff revenue is a benefit and can be redistributed to consumers or spent on goods from which consumers derive a benefit. But there are also efficiency costs associated with tariffs—deadweight losses, as we call them. These are the real costs of the tariff, and they arise because the marginal cost of production does not equal the marginal benefit to the consumer. Let us see how these concepts apply with the help of Figure 15.4.
Consumer surplus is the area under the demand curve and above the equilibrium market price. It represents the total amount consumers would have been willing to pay for the product, but did not have to pay, at the equilibrium price. It is a measure of consumer welfare. The tariff raises the market price and reduces this consumer surplus by the amount LFGJ. This area measures by how much domestic consumers are worse off as a result of the price increase caused by the tariff. But this is not the net loss for the whole domestic economy, because the government obtains some tax revenue and domestic producers get more revenue and profit.
Government revenue accrues from the domestic sales of imports. On imports of  , tax revenue is EFHI. Then, domestic producers obtain an additional profit of LECJ—the excess of additional revenue over their cost per additional bottle. If we are not concerned about who gains and who loses, then there is a net loss to the domestic economy equal to the areas CEI and HFG.
The area HFG is the consumer side measure of deadweight loss. At the quantity , the production cost of an additional bottle is less than the value placed on it by consumers; and, by not having those additional bottles supplied, consumers forgo a potential gain. The area CEI tells us that when supply by domestic higher-cost producers is increased, and supply of lower-cost foreign producers is reduced, the corresponding resources are not being used efficiently. The sum of the areas CEI and HFG is therefore the total deadweight loss of the tariff.
In the real world we should also be interested in the magnitude of the financial amounts involved here: In particular, how much more do consumers pay with the tariff in place, relative to the additional amounts going to domestic suppliers/corporations? How much tax revenue is generated? How many jobs are created domestically as a result of 'distorting' the market? Regardless of the magnitude of the two deadweight loss areas, which represent the net cost of the tariff, we should be interested in whether the owners of capital gain at the expense of consumers.
Tariffs by country of origin - trade diversion
The imposition of tariffs is governed by the World Trade Organization (WTO). Tariffs are permitted under the WTO rules in specific circumstances: if a particular economy is deemed to be subsidizing exports, and those exports have employment impacts on the destination economy, then a 'retaliatory' tariff may be imposed. A related justification is dumping. It is frequently difficult to prove subsidization or dumping by an exporting economy. An example of such a tariff was one placed by the US on washing machines originating in China in 2016, on the basis of a dumping claim by the United States. The immediate result of this was that the manufacturers located in China switched most of their production to other plants they owned in Vietnam and Thailand. In this particular instance there was virtually no impact on the retail price of washing machines in the US.
Dumping is a predatory practice, based on artificially low costs aimed at driving out domestic producers.
The traditional theory of tariffs described in 15.4 implicitly assumes that production and employment increase in the importing economy as a result of domestic production displacing imported goods. This analysis assumes that the tariff is imposed on a particular commodity, regardless of its economy of origin.
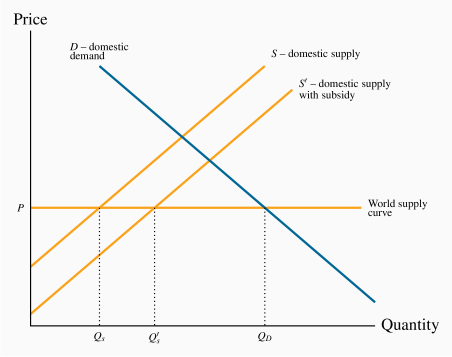
Production subsidies
Figure 15.5 illustrates the effect of a subsidy to a domestic supplier. As in Figure 15.4, the amount QD is demanded in the free trade equilibrium and, of this, QS is supplied domestically. With a subsidy per unit of output sold, the government can reduce the supply cost of the domestic supplier, thereby shifting the supply curve downward from S to  . In this illustration, the total quantity demanded remains at QD, but the domestic share increases to .
The new equilibrium represents a misallocation of resources. When domestic output increases from QS to , a low-cost international producer is being replaced by a higher cost domestic supplier; the domestic supply curve S lies above the international supply curve P in this range of output.
Note that this example deals with a subsidy to domestic suppliers who are selling in the domestic market. It is not a subsidy to domestic producers who are selling in the international market – an export subsidy.
This subsidy comes with a cost to the domestic economy: Taxpayers-at-large must pay higher taxes to support this policy; and each dollar raised in tax itself has a deadweight loss, as we examined in Chapter 5.
Quotas
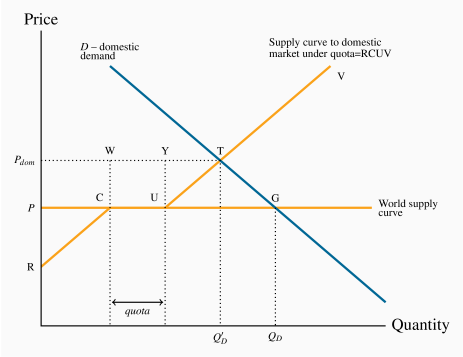
A quota is a limit placed upon the amount of a good that can be imported. Consider Figure 15.6, where again there is a domestic supply curve coupled with a world price of P. Rather than imposing a tariff, the government imposes a quota that restricts imports to a physical amount denoted by the distance quota on the quantity axis. The supply curve facing domestic consumers then has several segments to it. First it has the segment RC, reflecting the fact that domestic suppliers are competitive with world suppliers up to the amount C. Beyond this output, world suppliers can supply at a price of P, whereas domestic suppliers cannot compete at this price. Therefore the supply curve becomes horizontal, but only up to the amount permitted under the quota—the quantity CU corresponding to quota. Beyond this amount, international supply is not permitted and therefore additional amounts are supplied by the (higher cost) domestic suppliers. Hence the supply curve to domestic buyers becomes the supply curve from the domestic suppliers once again.
The resulting supply curve yields an equilibrium quantity  . There are several features to note about this equilibrium. First, the quota pushes the domestic price above the world price (
 is greater than P) because low-cost international suppliers are partially supplanted by higher-cost domestic suppliers. Second, if the quota is chosen 'appropriately', the same domestic market price could exist under the quota as under the tariff in Figure 15.4. Third, in contrast to the tariff case, the government obtains no tax revenue from the quotas. The higher market price under a quota means that the price per unit received by foreign suppliers is now rather than P. De facto, instead of tax revenue being generated in the importing economy, the foreign supplier benefits from a higher price. Fourth, inefficiencies are associated with the equilibrium at . These inefficiencies arise because the lower-cost international suppliers are not permitted to supply the amount they would be willing to supply at the quota-induced market equilibrium. In other words, more efficient producers are being squeezed out of the market by quotas that make space for less-efficient producers.
Application Box 15.3 Cheese quota in Canada
In 1978 the federal government set a cheese import quota for Canada at just over 20,000 tonnes. This quota was implemented initially to protect the interests of domestic suppliers. Despite a strong growth in population and income in the intervening decades, the import quota has remained unchanged. The result is a price for cheese that is considerably higher than it would otherwise be. The quotas are owned by individuals and companies who have the right to import cheese. The quotas are also traded among importers, at a price. Importers wishing to import cheese beyond their available quota pay a tariff of about 250 percent. So, while the consumer is the undoubted loser in this game, who gains?
First the suppliers gain, as illustrated in Figure 15.6. Canadian consumers are required to pay high-cost domestic producers who displace lower-cost producers from overseas. Second, the holders of the quotas gain. With the increase in demand for cheese that comes with higher incomes, the domestic cheese price increases over time and this in turn makes an individual quota more valuable.
In the 2018 United States Mexico Canada Agreement, a slight increase in access to Canadian markets was granted in return for a corresponding increase in access to the US market.