Creating Curriculum-Based Measures in the Content Area
Making Data-Based Decisions
Since the passage of the No Child left behind act of 2001, focus on student achievement has become a major issue within education. Parents and legislators have discussed both the need for improvement of student performance and the inordinate amount of time spent testing students (Layton, 2015). In response to growing concerns over the amount of time spent testing, the Council of the Great City Schools (CGCS; 2015) conducted a study of 66 large school districts and found students spent 20 to 25 hours of instructional time per year on standardized testing in grades three through 11. This study further described that the average student will take approximately 8 standardized tests per year in reading and math and three formative exams in at least two subjects. In response to this report, the United States Department of Education (USDOE, 2015) released an action plan that, among other things, suggested that students should spend no more than 2% of instructional time taking assessments and that the clear majority of assessments should be tied to improvement in student learning. These sentiments were reiterated in the passage of the Every Student Succeeds Act of 2015 (ESSA) and a brief published by the USDOE in 2016 which called for reducing test time and implementing fair and more innovative tests.
Special Education has, in many respects, become synonymous with the assessment of students. Indeed, one of the mainstays of current special-education practice is utilizing data to inform the goals in a students’ individual education programs (IEPs), to inform instructional practices, and modify them as necessary. In addition, the current focus on preventative measures based on a response to intervention (RTI) approach, though generally a school-wide assessment system, was largely born out of special education (See Figure 1). Specifically, RTI was initially proposed as a method of providing early intervention and identification services to reduce the number of students being falsely identified as learning disabled (LD) due to poor instruction and a flawed assessment approach (IQ-achievement discrepancy).
It could be said, then that RTI initiatives and special education could be blamed for at least some of the increased amount of testing conducted in schools. For example, these models ask that universal screening measures (USM; also referred to as benchmark assessments) be delivered to students three times per year to determine those students who are at-risk for learning, social, and/or behavioral disabilities (Fuchs & Fuchs, 2005; Fuchs & Fuchs, 2006; Lane, Ennis, Kalberg, & Carter, 2007). These universal screening measures (e.g., Dynamic Indicatorsof Basic Early Literacy Skills [DIBELS] and Measures of Academic Progress [MAPS]) are meant to be brief measures to determine skill level. However, because some of these measures (e.g., DIBELS) require individual student testing by the teacher or para professional, they can become laborious and time consuming in an already full teaching day.
What is RTI?
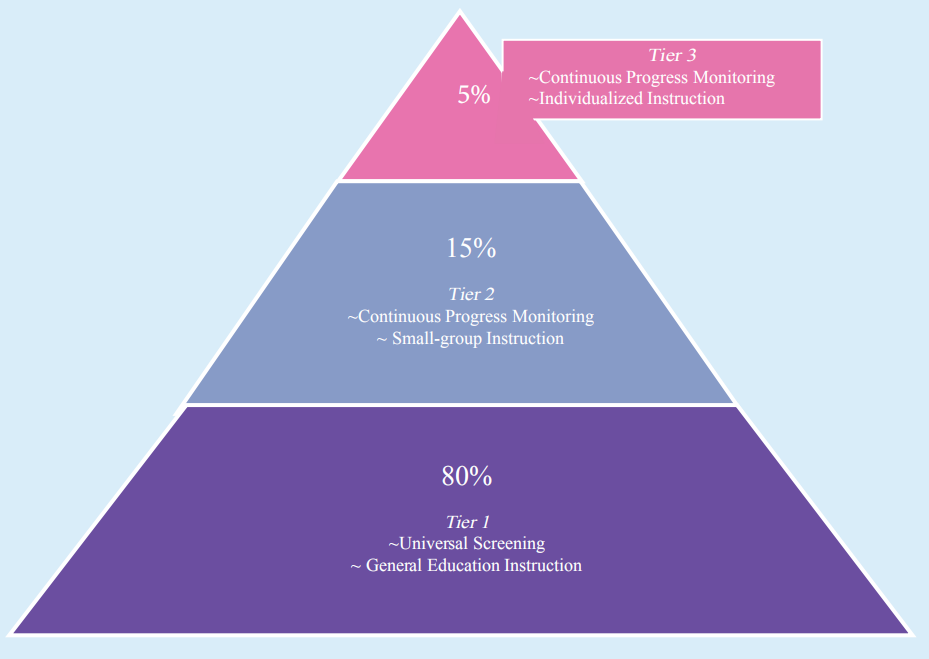
The RTI framework has since been expanded to include three-tiered models of prevention that include behavioral and social emotional systems. With this expansion, acronyms have exploded to describe similar constructs: RTI, multi-tiered systems of support (MTSS), positive behavioral intervention and supports (PBIS), and comprehensive, integrated, three-tiered models of prevention (Ci3T). In most cases, these acronyms are synonymous and simply reference utilization of a three-tiered model (see below) of prevention where Tier 1 (approximately 80% of students) is universal instruction; Tier 2 (15% of students) are students determined to be at-risk and receive small group instruction, and Tier 3 (5% of students) are those needing specialized instruction, or special-education. Thus, for the sake of clarity and ease of understanding, this text will use the term RTI to describe the threetiered models of prevention broadly, not just its oft limited use to describe assessment of learning disabilities.