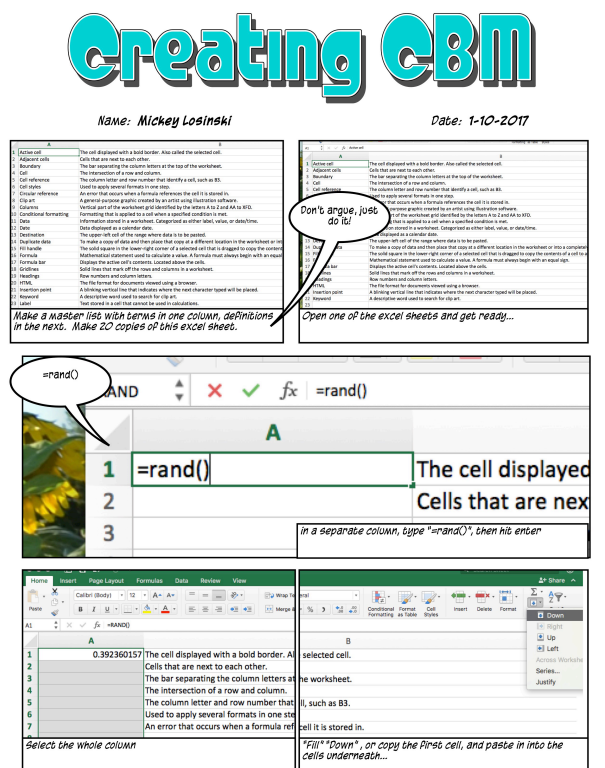
So, we’ve collected all this data on our students, now what do we with it? Indeed, the collection of data is meaningless without utilizing the power of it. For example, Stecker and Fuchs (2000) conducted a study with students with mild disabilities who each had a learning disability, to determine if decision-making based on CBM was better than decision-making without. Specifically, students were matched based on equality on certain variables (e.g., age, functioning).
Figure \(\PageIndex{1}\)
CBM measures of one of the students in the matched pair. The second student received the same change in instruction as did the one who the teacher monitored. Results of the study showed a significant improvement in criterion tests for those students whose instruction was being changed based on their data as opposed to changes made without regard to the student’s performance. In essence, students whose performance was monitored using CBM outperformed those students whose performance was not being monitored. Implications of this study, and others like it, should be obvious: monitoring student progress and making decisions based on that progress are imperative. Thus, the remainder of this chapter will be dedicated to making decisions based on CBM data.
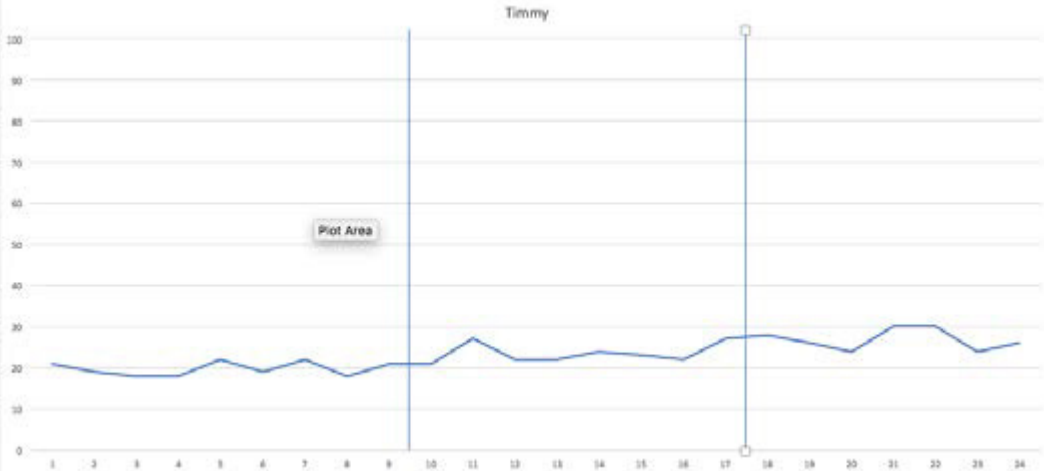
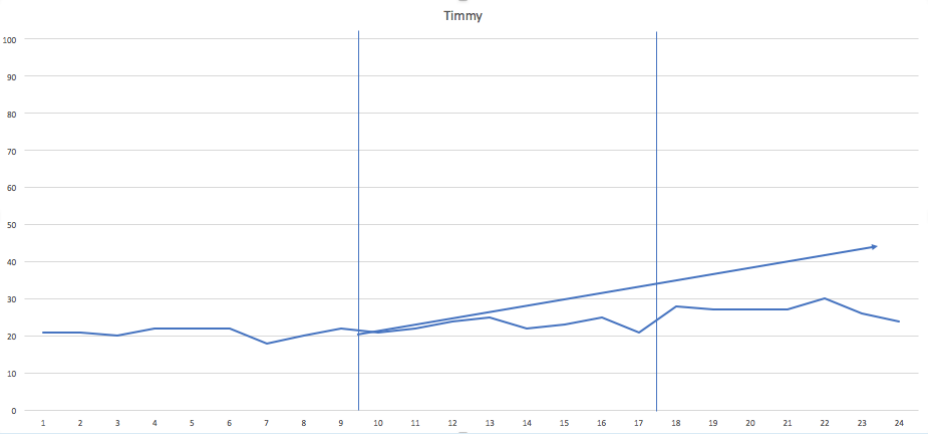
As seen in Figure \(\PageIndex{2}\), two vertical lines are added to the progress monitoring graphs. These vertical lines note when an intervention was put into place, and are called intervention lines. This gives us a handy way to determine when interventions were put in place and if enough time has passed to make another decision. These lines also allow us to utilize graphs during parent teacher conferences to show parents and other members of the team what interventions are being applied and the effect of those interventions.
Figure \(\PageIndex{2}\)
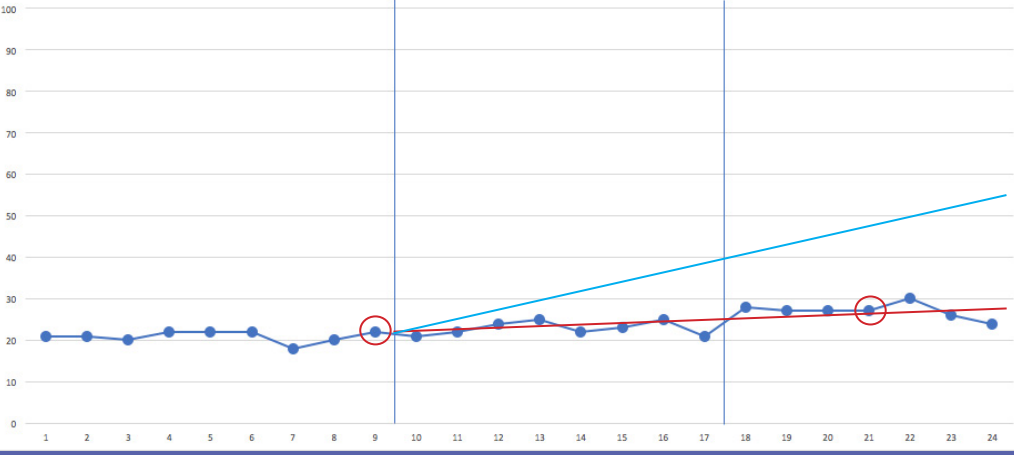
Now, how do we know when to draw those lines? There are two main rules that can be used to make decisions on when to adjust instruction. The first rule is simple: “four strikes, move on!” In other words, if the student’s scores on four consecutive probes do not exceed the goal line, an intervention change is warranted (Hosp, Hosp, & Howlell, 2007). Notice in Figure \(\PageIndex{3}\), Timmy’s score on four consecutive measures did not exceed the goal line even though they were close. In this case the intervention was changed. The second rule for making these decisions is a little bit more complicated, but perhaps more sensitive. This rule makes use of line slope (goal and actual) to determine whether an intervention change is warranted or no. To determine actual slope, divide the student’s scores into 3 equal sections (See Figure \(\PageIndex{4}\)). If the number of scores is not divisible by 3, put three at the beginning and 3 at the end with the uneven number in the middle. Next, select the median of the first set and the median of the second set. Draw a line from the end of the 1st set (at the median on the Y axis) to the end of the second set (at the median on the Y axis; red line). You would then determine whether or not the student’s actual line will meet or exceed the goal line (blue line) or, if it will not, an intervention is warranted (Hosp, Hosp, & Howell, 2007).