The United States is home to about five percent of the world’s total population and twenty-five
percent of the world’s prison population.318 An increasing use of prisons to control crime and a
vast rate of prison growth has occurred in the past thirty years. During this time, the U.S.
population rose 40 percent while the U.S. prison population rose 400 percent. This issue is
urgent to study since more than two million people are currently incarcerated in over 5,000
facilities in the U.S.; these facilities include prisons, jails, youth centers, and immigrant detention centers.
- 99% of prisoners are poor (financial ghosts)
- Between 72 and 75% of prisoners did not complete high school
- 2/3 of people in prison are people of color
- Close to 80% of people in prison are convicted of nonviolent crimes
- 51.8% of prisoners are incarcerated for nonviolent drug offenses
- Men make up about 95% of the overall prisoner population
- Women represent the fastest growth rate in prison
- 40% of women in prison earn less than $600/month prior to incarceration
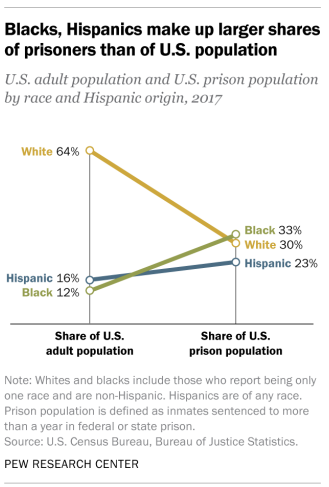
Figure \(10.5.1\): Graph of US and Prison Populations by race, 2017319
The number of incarcerated women increased from 26,326 to 152,854 from 1980 to 2020, according to the Justice Department. That is an increase of 475% percent, compared with a 140 percent rise in the male prison population.320 What on Earth could have happened in only 40 years that we’d see 475 percent increase in women in prison? Maybe more women started committing more crimes? Not enough to explain a 475 percent increase. Maybe the divorce rate increase caused more women to commit crimes? Nope. Maybe a bunch more women went out while they were PMSing and had finally had enough and started committing crimes in unprecedented numbers? No way (and the PMS defense doesn’t make sense, so don’t use it). The main contributing factor to the increase in female inmates is the war on drugs. Even the second wave of feminism (which fizzled out in the early 70s) couldn’t explain that kind of inmate increase. Drug laws in the 80s (which were simultaneously passed when the market became saturated with crack cocaine) made it easier for masses to be incarcerated for non- violent drug offenses. The proportion of imprisoned women convicted of a drug offense, alone, has increased from 12% in 1986 to 26% in 2019.321
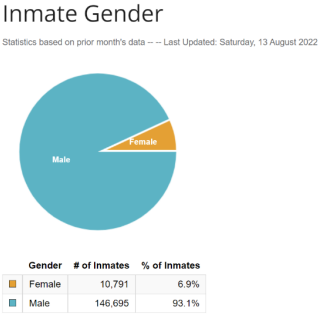
Figure \(10.5.2\): Pie Chart of numbers and percentages of inmates by gender322
In 2020, the imprisonment rate for Black women (65 per 100,000) was 1.7 times the rate of imprisonment for White women (38 per 100,000), and the rate for Hispanic/Latinx women were imprisoned at 1.3 times the rate of White women (48 vs. 38 per 100,000).
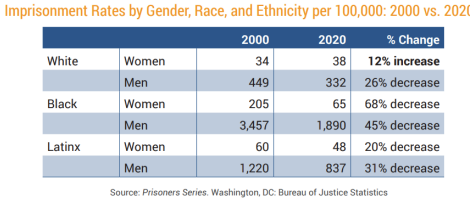
Figure \(10.5.3\): Inmates Rates by Gender, Race, and Ethnicity per 100,000: 2000 vs. 2020323
And while the growing number of women who work helps to explain why they are committing more forgery and embezzlement, the great majority of women in prison are poor and unemployed and not models of newly empowered, liberated women. While the fact that people released from prison have difficulties finding employment is well-documented, there is much less information on the role that poverty and opportunity play in who ends up behind bars in the first place. However, this table from the United States Justice Bureau shows the inequality between men and women’s earnings as well as the lower income incarcerated people were earning prior to their incarceration. Pie Chart of numbers and percentages of inmates by gender.
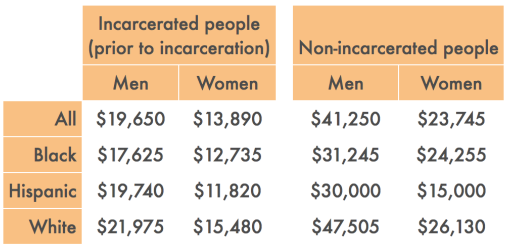
Figure \(10.5.4\): Median annual incomes for incarcerated people prior to incarceration and non-incarcerated people, 2014, by race, ethnicity, and gender324
As discussed in previous chapters, there is a wage gap between men and women and between racial adn ethnic groups. While the gap in income is most dramatic for White men, as White men already have the highest incomes outside of the incarcerated population. By contrast, the income gap is smallest for Hispanic women, but Hispanic women have the lowest incomes to begin with. Both the cycles of poverty and incarceration are racialized and gendered.
319 Gramlich, John. (2019). The gap between the number of blacks and whites in prison is shrinking. Pew Research Center. https://www.pewresearch.org/fact-tank/2019/04/30/shrinking-gap-between-number-of-blacks-and-whites-in-prison/
320 Bureau of Justice Statistics: Historical Corrections Statistics in the United States 1850-1984 (1986); Prison and Jail Inmates at Midyear Series (1997-2020), Prisoners Series (1980-2020). Washington, DC
321 Carson, E.A. (2021). Prisoners in 2020 – Statistical Tables. Washington, DC: Bureau of Justice Statistics
322 Graph by the Federal Bureau of Prisons is in the public domain

