
1.6: Geographic Data Collection and Analysis
- Page ID
- 38643

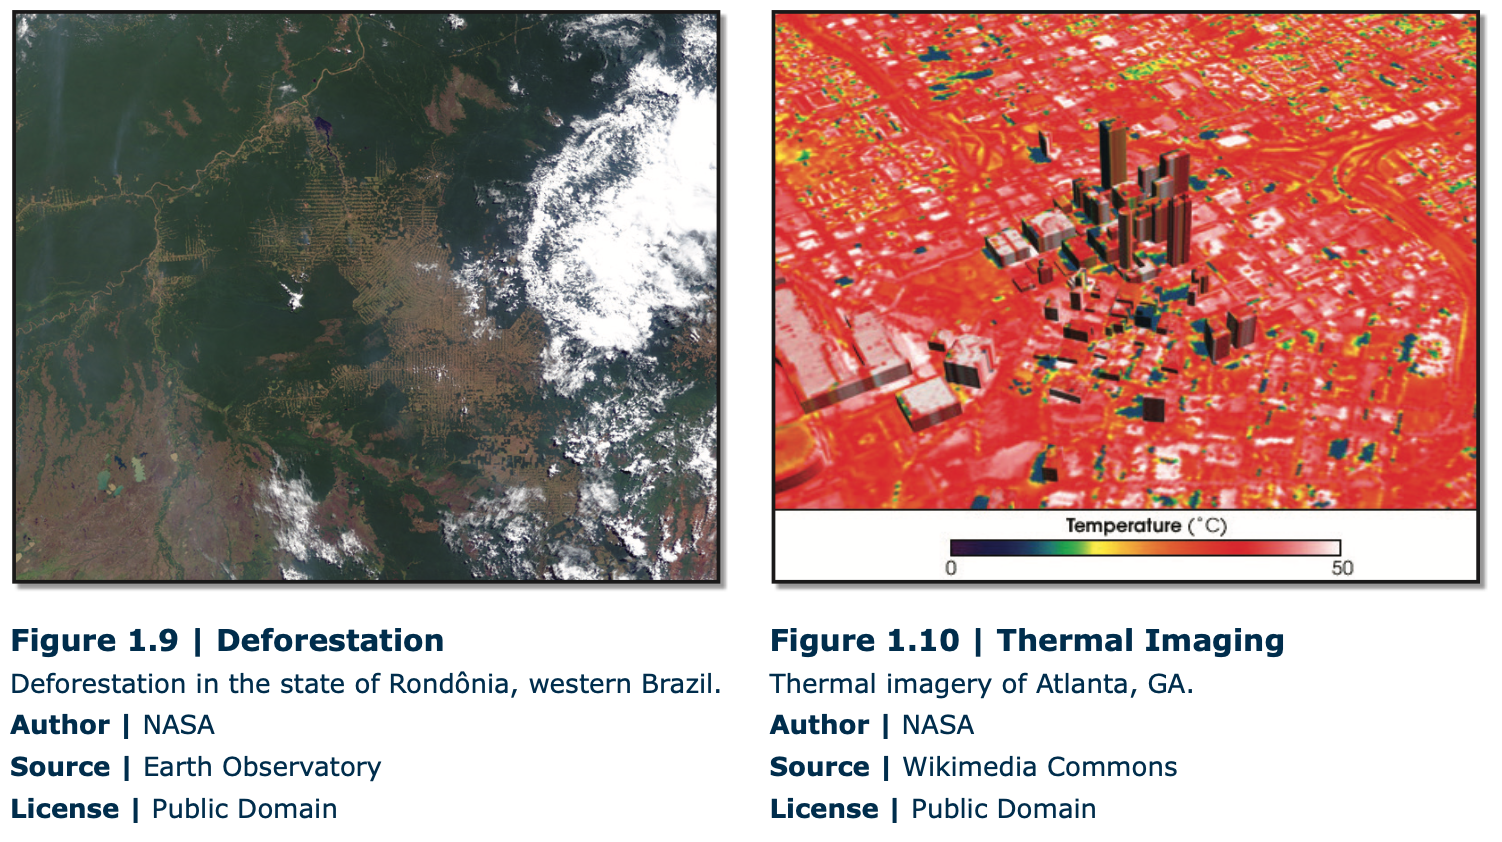
In order to analyze and develop regions, describe places, and conduct detailed geographic analysis, two important tools have been developed that are of particular value to geographers. The first is remote sensing, or the acquisition of data about the Earth’s surface from aerial platforms such as satellites, airplanes or drones. Images taken from these airborne machines can provide a wealth of valuable information about both the human and physical characteristics of a place. For example, satellite imagery can depict the extent of human impact on rainforests in the Amazonian rainforest of Brazil (Figure 1.9). Imagery can also depict information that humans cannot see with the naked eye, such as the temperature of the Earth’s surface. One example is a thermal infrared image, which can show warm temperatures in red tones and cooler temperatures in blue tones (Figure 1.10).
Digital imagery like the one in Figure 1.9 is in a format that can be entered into Geographic Information Systems (GIS), the second important tool employed by geographers. GIS combines computer hardware and software in a system that stores, analyzes and displays geographic data with a “computer mapping” capability.
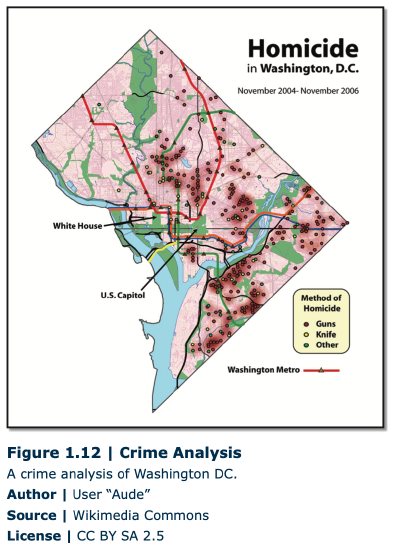
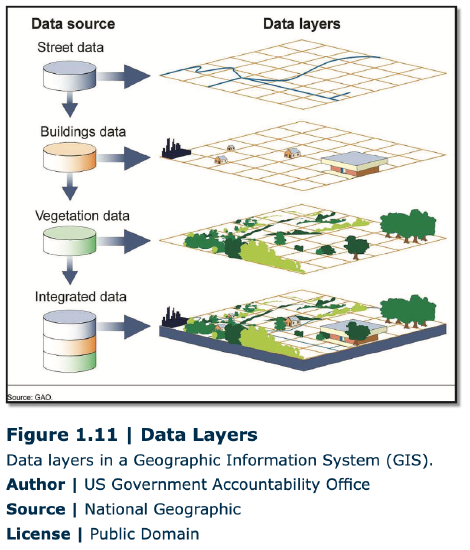
Geographic data is stored in layers, and these layers of data can be queried in a number of sophisticated ways to analyze some aspect of an area (Figure 1.11). Each data point in a GIS is georeferenced to a precise location on the Earth’s surface (latitude and longitude, for example), and these data points have different attributes corresponding to the data layer they are associated with. Data layers can represent a myriad of characteristics about that data point, such as elevation, soils, the presence of water, per-capita income, ethnicity, etc. Overlaying the data layers can provide incredible insights into the connections between characteristics/ factors in places, such as the connection between per-capita income and ethnicity or the links between soil types and vegetative cover. GIS also has a vast suite of other capabilities such as least-cost path for transportation, line-of-sight perspectives from a particular location, or 3-D models of urban areas. Because of their multi-faceted capacity to present geographic information, businesses and government agencies around the world use GIS to answer questions, plan development, chart delivery routes, and even monitor crime and first responder activity (Figure 1.12). It is not surprising that one of the fastest growing job markets is in GIS technology, as GIS jobs exist at the local, state, and national level as well as in many businesses in the private sector. Even the U.S. Census Bureau maintains an extensive GIS database known as Topologically Integrated Geographic Encoding and Referencing (TIGER).