
8.5: The Electoral Process
- Page ID
- 38691

8.5.1 Gerrymandering
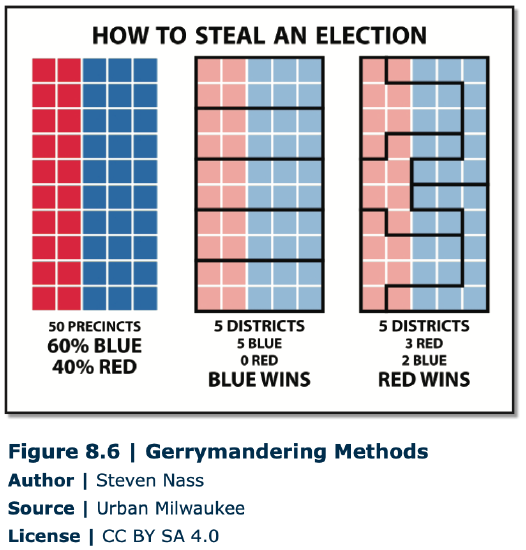
In the United States, boundaries play an important role in the electoral process, but in this case, district, and precinct boundaries are significant in contrast to the country boundaries that have been previously discussed. Political parties in power will sometimes rearrange the boundaries of voting districts in order to ensure victory in elections, and this practice is called gerrymandering. Gerrymandering strategies can involve drawing the boundaries so that the majority of voters in a district favor the party in power. Another method is to segregate the opposition voters into several different districts (Figure 8.6). While gerrymandering is not generally illegal in the United States, it can be challenged in court when it appears to clearly discriminate against minority populations. For example, when legislative districts where redrawn in 2015 in Gwinnett and Henry counties in Georgia, the NAACP filed a federal lawsuit because of the perception that the adjustment violated the rights of minority black voters. A 2013 Supreme Court decision, however, declared that a requirement in the 1965 Voting Rights Act for federal oversight of redistricting is not constitutional, and this decision may have an impact on such lawsuits.
8.5.2 Presidential Elections
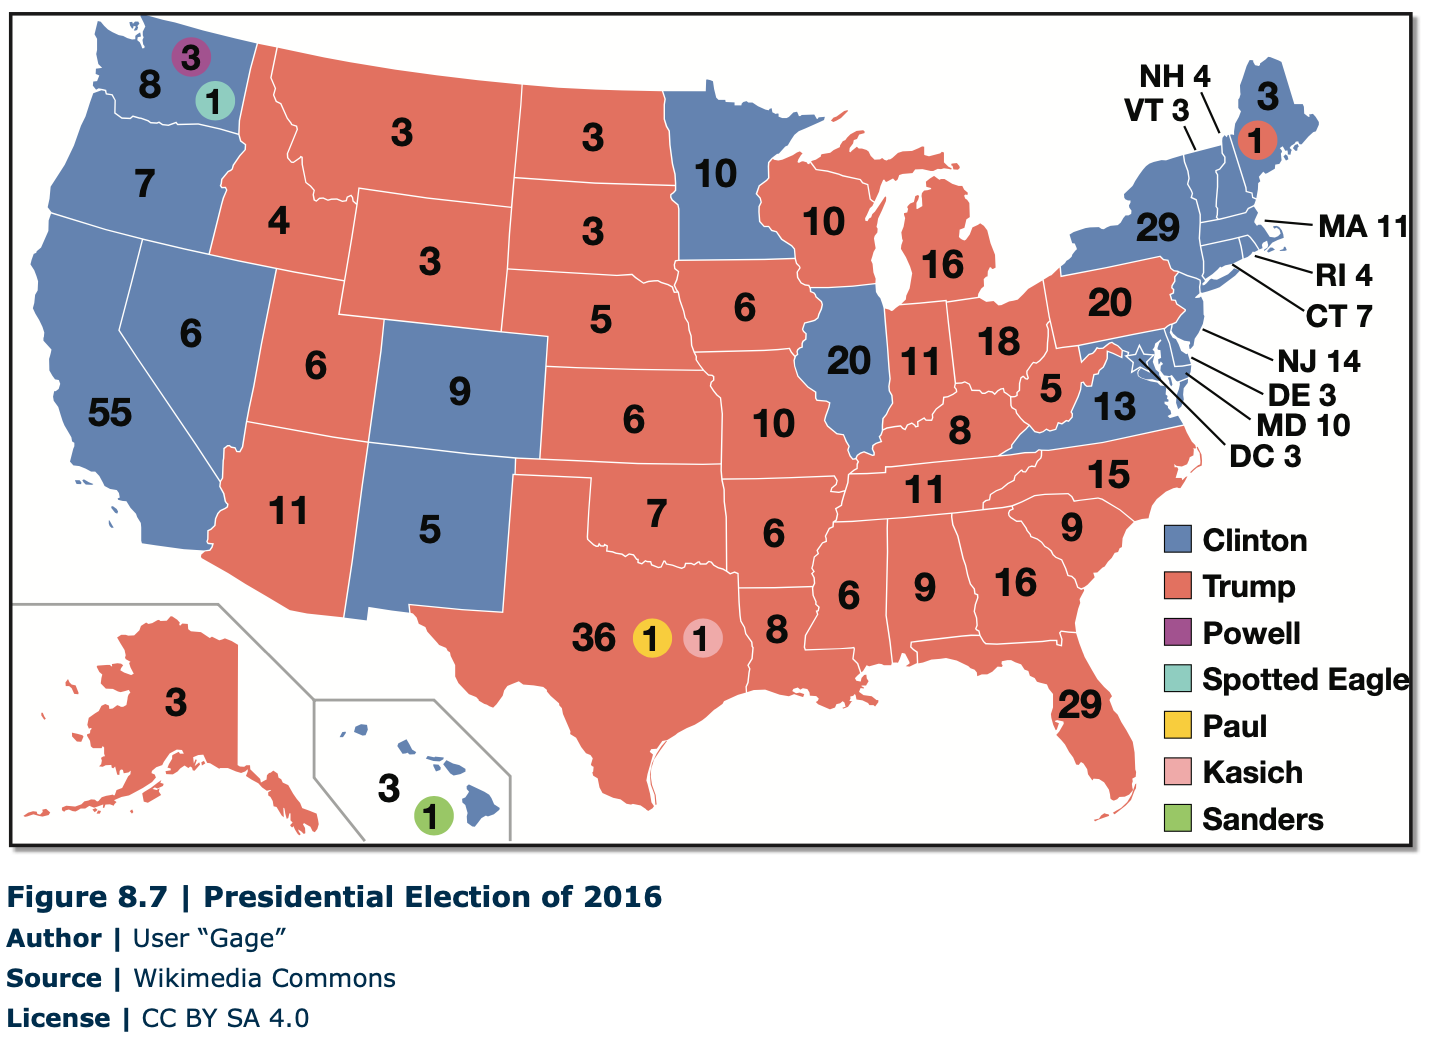
One of the more intriguing aspects of political geography in the United States is presidential elections and how the Electoral College process has a decidedly spatial component. An examination of the presidential results from the 2016 election reveals interesting regional affiliations (Figure 8.7). Northeastern and Mid-Atlantic states, as well as far Western states, all tended to vote Democrat, while the rest of the electoral map is Republican. Although it appears that the Republican victory was decisive from a spatial and Electoral College perspective, from the standpoint of the popular vote, Democrats actually had more votes than Republicans. The dichotomy is explained by the very large populations in both California and New York, predominantly Democrat states. California’s large population is reflected in a high number (55) of Electoral College votes, more than any other state.
Another marked trend in the voting map is evident when the election results are examined by county (Figure 8.8). Ethnic groups tend to vote in particular voting blocks, and the impact of ethnic groups can be seen more clearly by looking at individual counties. For example, a crescent of blue (Democrat) can be seen running through south-central Alabama and into eastern Mississippi. African Americans tend to vote Democrat, and these blue counties contain predominantly African American voters.
Similarly, the blue counties in western Mississippi have a majority African American population. Another example of the influence of ethnic groups is evident in extreme southern Texas. Hispanics generally vote Democrat, and most counties in southern Texas are dominated by Hispanics.
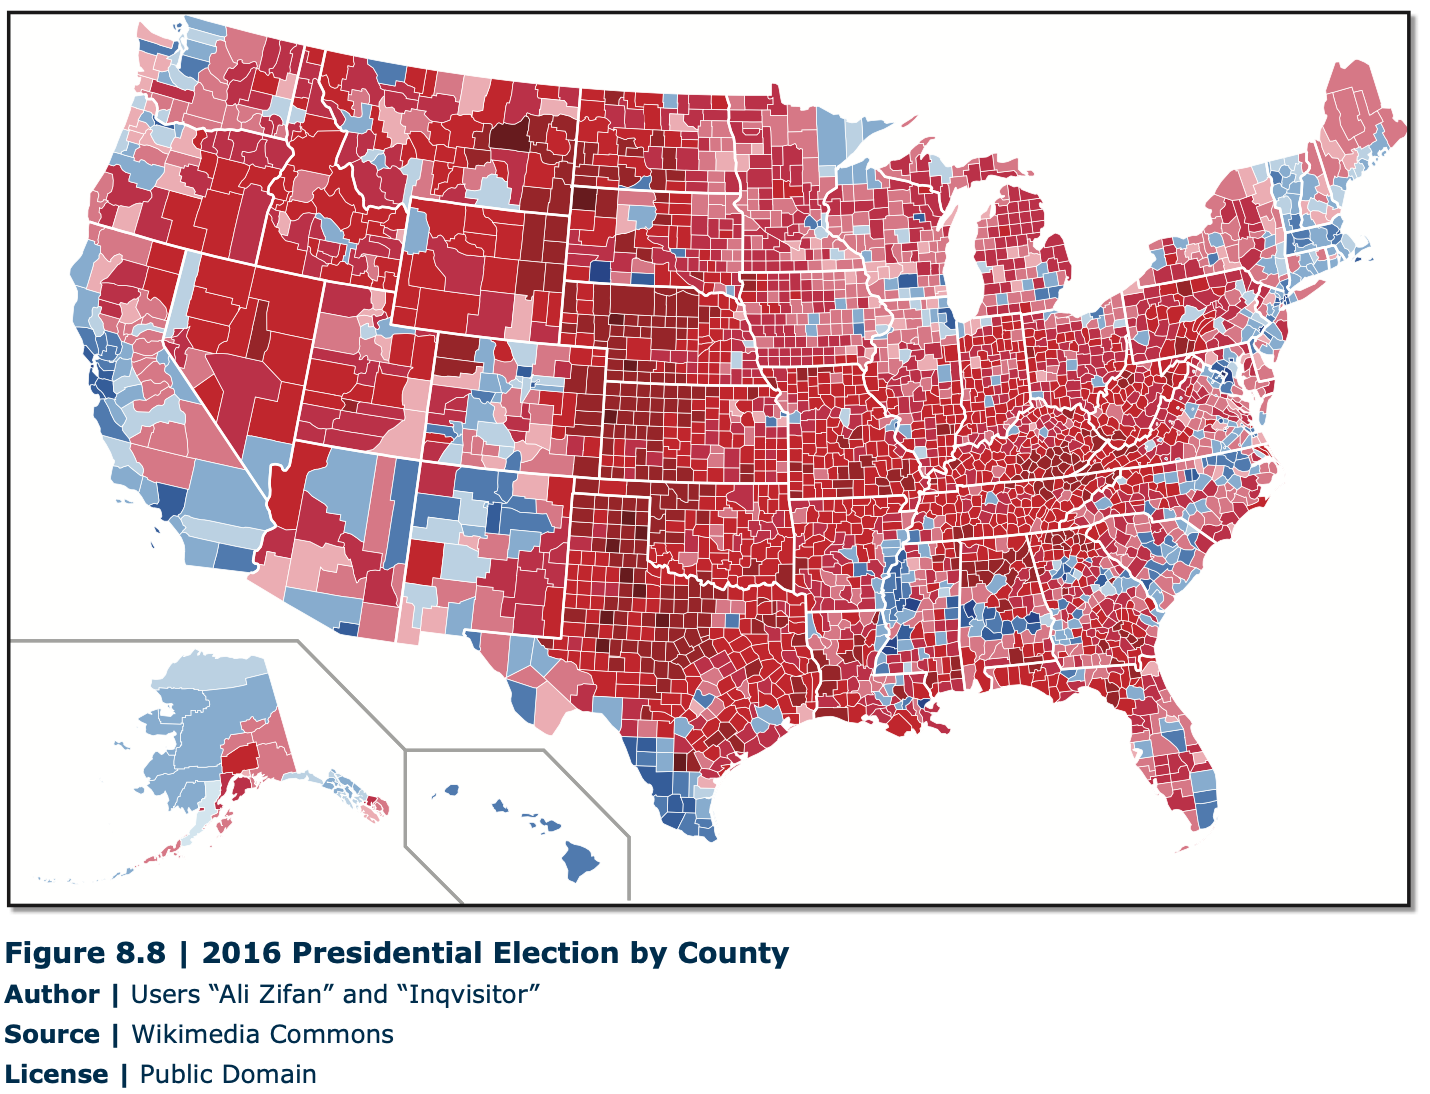
Related to ethnic affiliations by county is the trend for rural voters to lean toward Republican and urbanites to vote Democrat. Rural areas tend to have white majorities, and whites tend to vote Republican. Rural voters also have lower numbers of college graduates compared to urban areas. In the 2016 presidential election in both Georgia and Texas, urban counties tended to vote Democrat, and rural counties went to the Republicans. With increasing urbanization and diversity in the United States, the electoral map will continue to undergo significant changes in the future.