
3.3: Global, National, Regional, and Local Patterns
- Page ID
- 38654

3.3.1 Global Patterns
Though geopolitical and global economic forces change over time, it is useful to understand contemporary global, national, and regional patterns of migration as processes that vary by geography. The vast majority of people do not migrate internationally, yet migration makes a powerful impact globally. Just imagine what our world would look like if nobody ever moved! Latin America would have no coconut trees, the American Midwest would still be dominated by buffalos, and most humans would look very much alike—how boring! Instead, migrants across the globe diffuse new ideas, new genetic footprints, new diseases, new cooking styles, and new sports. While a small number of countries receive large numbers of newcomers each year, only 3.4 percent of the world’s population live outside of their birth country, so most places in the world are not significantly impacted directly by international migration. However, the dynamics of migration are undergoing a significant transformation, and the future is very difficult to predict. Humans have been on the move for over 60,000 years, so it is unlikely to come to a halt anytime soon.
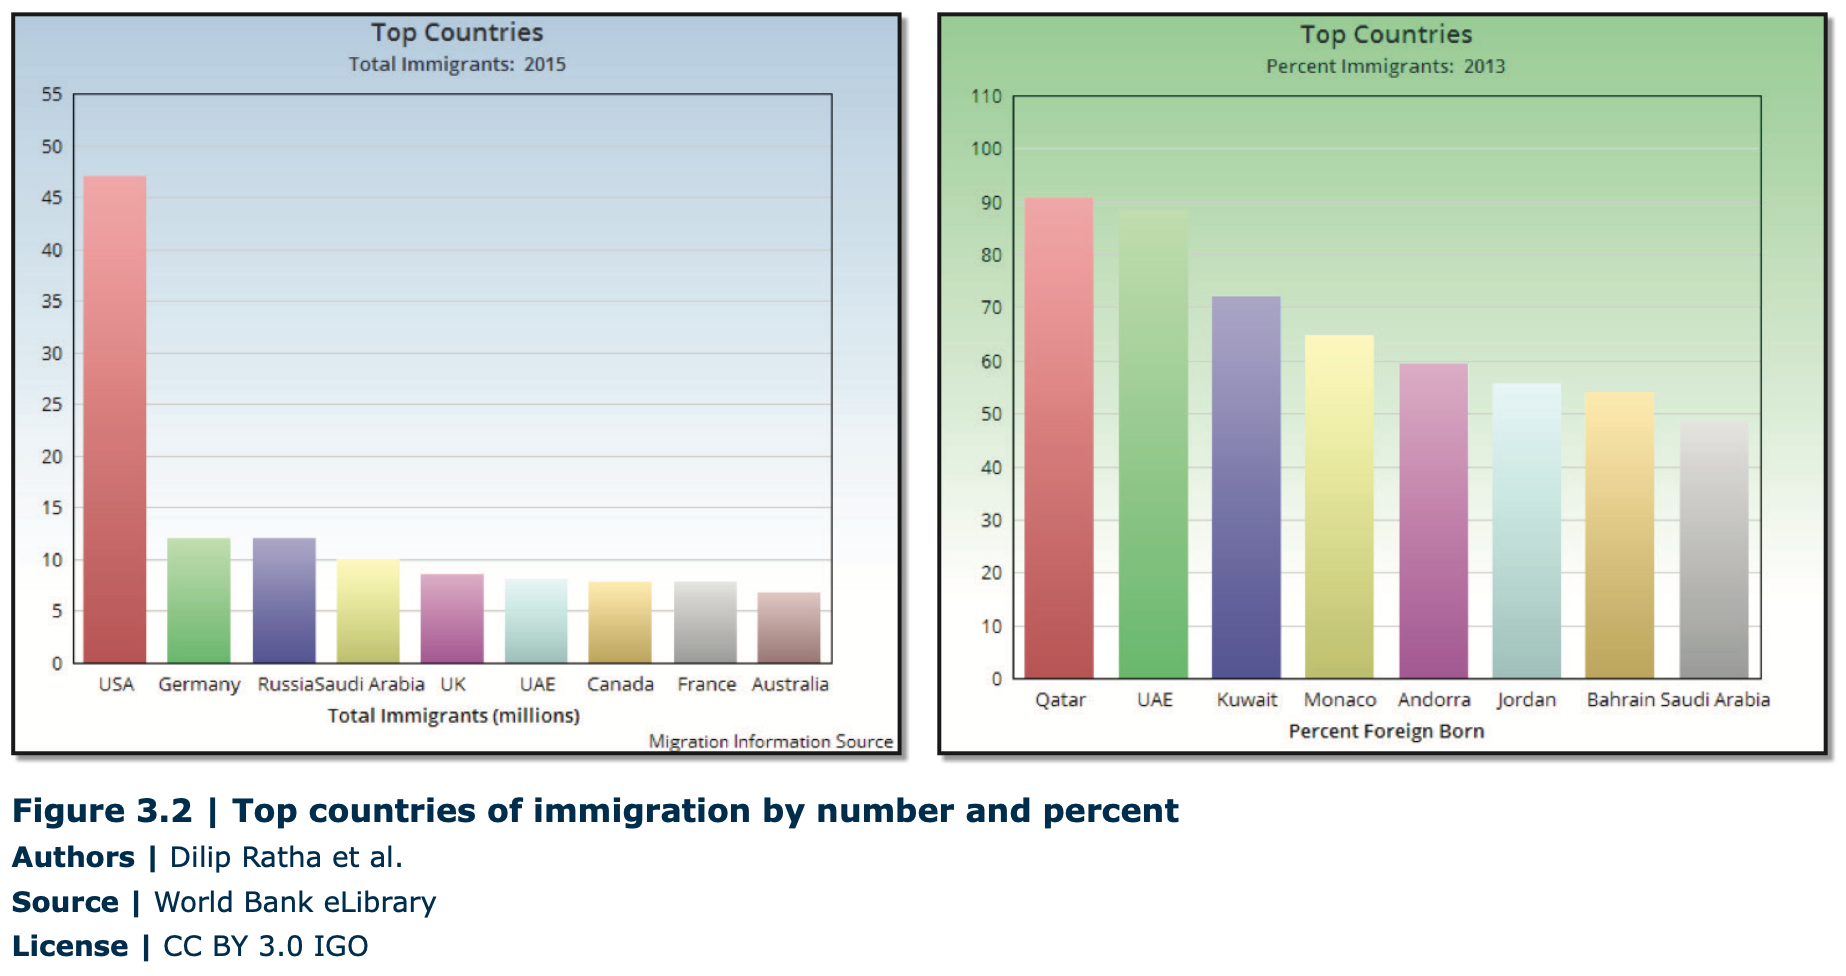
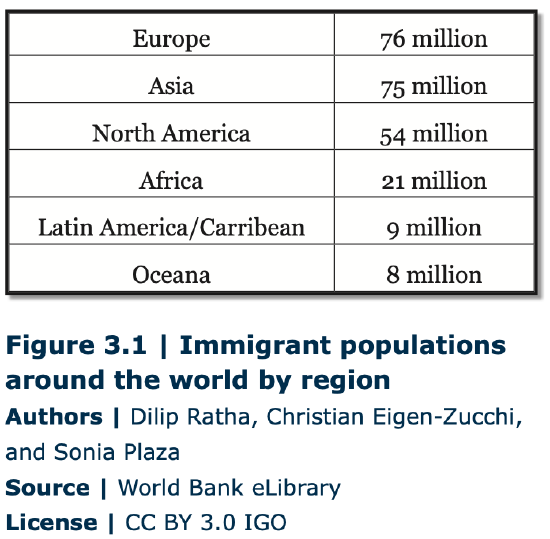 The number of international migrants worldwide reached 244 million in 2015, representing a 44 percent increase since the year 2000 (Figure 3.1). During the same period, global population grew by just 20 percent, so cross-border migration seems to be accelerating in many parts of the world as more people have access to information, infrastructure, and communication—all elements that facilitate the large-scale movement of people. In 2015, nearly 70 percent of all migrants originated in either Europe or Asia, with the largest numbers coming from India, Mexico, Russia, and China. Meanwhile, those countries hosting the most immigrants were the US (47 million), followed by Germany (12 million), Russia (12 million), and Saudi Arabia (10 million) (Figure 3.2). Generally speaking, migrants tend to move away from low/middle income countries into high income countries because the most common driving force is economic opportunity. Most migrants move for better jobs, higher incomes, and better opportunities overall. It is worth noting, however, that about one third of international migration takes place between lower income countries (e.g. from Bangladesh to India or from Afghanistan to Iran).
It is also important to note that patterns can change very quickly, depending upon economic or political conditions. Spain, for example, was a major recipient of immigrants from 2000-2008, but when its economy dipped and job opportunities decreased, people began to leave en masse. In every year since 2011, more people have left Spain than have arrived. Ireland, on the other hand, experienced mostly net emigration from the mid 1800’s until the late 1990’s, when large numbers of Irish and descendants returned “home” and new immigrants began to choose Ireland as a popular destination due to its improved economic opportunities under the European Union.
3.3.2 Regional Migration Flows: Europe
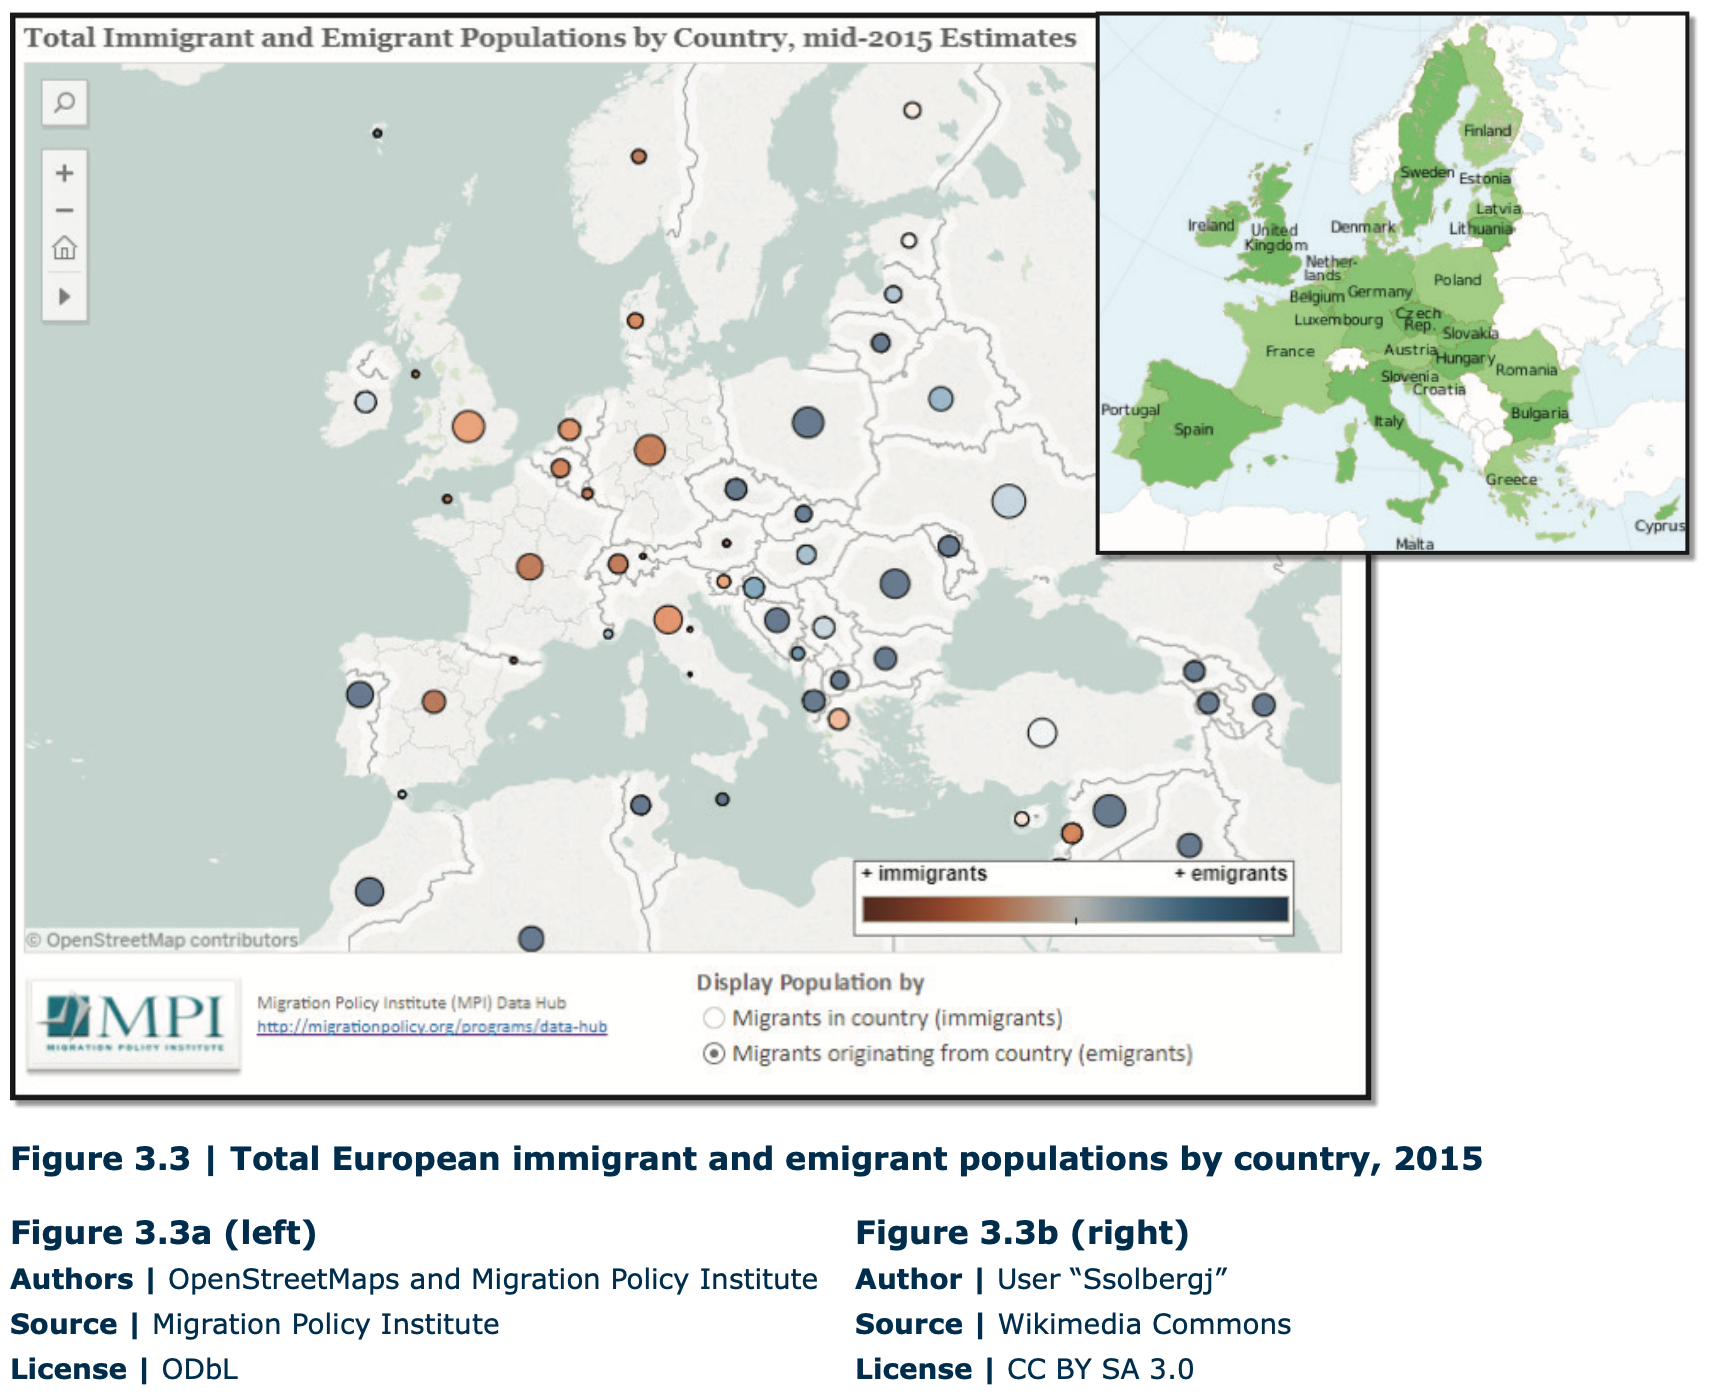
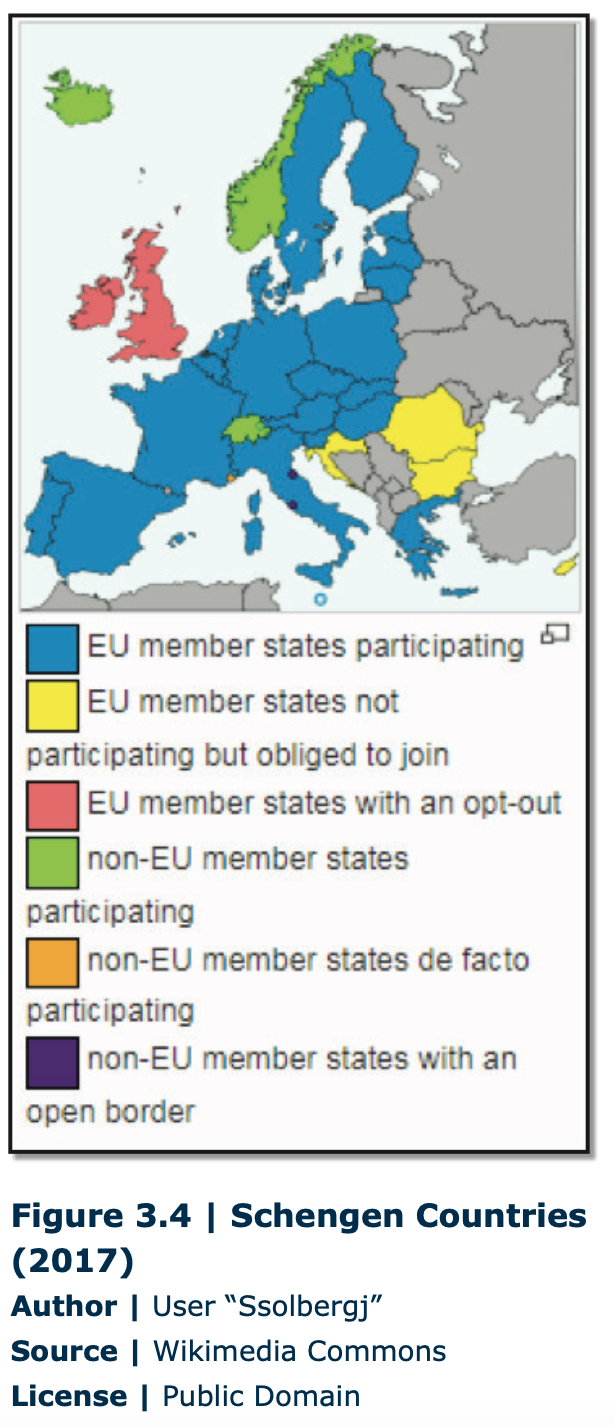
Consistent with Ravenstein’s “Laws of Migration,” most international moves continue to take place across relatively short distances. In no place is this more evident than in Europe, where it also quite common to find Spaniards in France, Germans in Switzerland, Romanians in Germany, etc. As portrayed in the map above, movement within Europe tends to be from East (blue dots) to West (red/orange dots) (Figure 3.3). Given the ease of travel within, the small size of, and short distances between many European countries, it is not surprising that many people move across borders for a variety of reasons. Of the 508 million residents of the European Union (EU), about 10 percent (54 million) are foreign born, of which 35 million originate outside of the EU and 19 million moved from one EU country to another. Movement within and to the EU has accelerated in recent decades for two reasons. First, Europe has intentionally worked towards greater economic integration and cooperation since WWII by removing barriers to movement (See more about the EU in Chapter 8). Citizens and legal residents of participating EU member states may travel, live, study, and work seamlessly across national borders under the Schengen Agreement (Figure 3.4). While the EU facilitates the free movement of capital, products, and services in the region, the agreement permits the free flow of people across international borders without significant delay, hassle, or regular security checks. Millions of working-aged residents of Poland, Romania, and Bosnia, for example, have moved to countries like Germany, France, and Spain for higher wages. In some ways, the European region has become similar to the US in that Spaniards may travel to France just as easily as Californians may travel to Oregon.
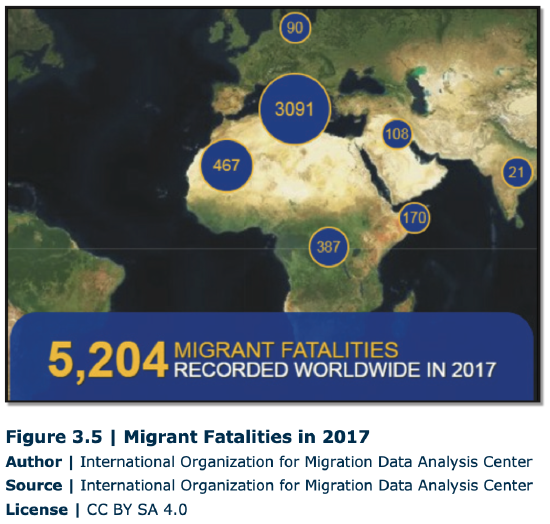
The second reason for increased movement and mobility in Europe, however, is that more people from nearby Africa and the Middle East have attempted to enter Europe to seek work, escape conflict, or find better educational opportunities. Although economic and political life has been relatively more attractive in Europe than in neighboring regions for some time, the forces of globalization have accelerated such flows. Human smuggling organizations transport hopeful migrants in exchange for large amounts of money. As such, the EU has increased maritime military patrols in the region, which has forced human smugglers and would-be immigrants into riskier and more perilous routes. Thousands die each year trying to gain entry to another country (Figure 3.5). In 2016, approximately 7,400 died during a migration route, and nowhere is the trek riskier than in the Mediterranean, where 4,800 migrants perished in 2016, most of whom were from African countries. Additionally, conflicts in the Middle East, most notably Syria, have driven hundreds of thousands to seek refuge in Europe.
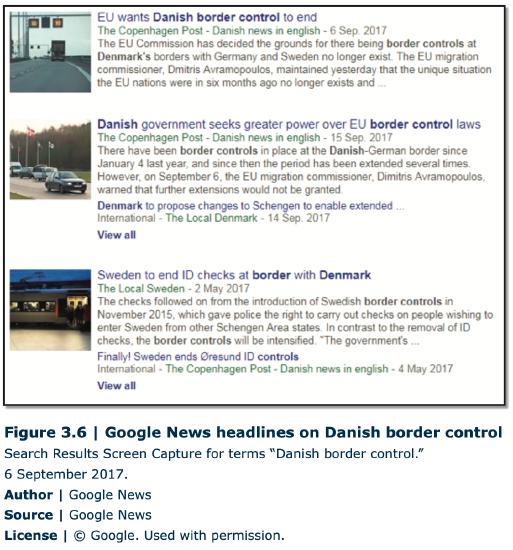
The free flow of people across the European region has come into question in recent years as northern member states mistrust the vetting process put into place by southern and eastern European states. An individual that manages to enter any of the Schengen states can travel quite easily to any of the other European states. Denmark and Sweden, for example, have increased border security and border checks in spite of being signatories to the agreement (Figure 3.6). The bold experiment in Europe to integrate so many cultural, linguistic, and political systems faces constant challenges and has no guarantee for long-term success. Twice in the last century, the region was wartorn. As the twentieth century unfolds, Europe remains a focal point for migration policy and practice into the twenty-second century.
 3.3.3 Regional Migration Flows: North America
North America represents a special case in that the US routinely receives significantly more immigrants than any other country in the world. Roughly 14.5 percent (46 million) of all residents in the US were foreign born in 2015,representing seventeen percent of the labor force. In Canada, the numbers were roughly twenty-one percent for both categories. The International Organization for Migration (IOM), sponsored by the United Nations, offers a great tool for visualizing migration around the world (https://www.iom.int/ world-migration). Click on the tool to find out how many in the US came from China or how many from the US lived in Mexico last year (hint: toggle the In/Out button). Do you notice any patterns? Click on a few other Caribbean countries to view the flows of migration into North America. You will notice that the largest source areas to the US were Latin America and Asia, but sending countries and volumes, in fact, vary significantly over history. The figure below shows changes over time in the US immigrant population, and you can see that immigration from Latin America and Asia has only occurred in the most recent period. Do you know or think you know when your ancestors arrived? Can you visualize the time period during which they first came to North America? Which population groups are not included in the chart? Why do you think this might be?
There four distinct phases of immigration, but let’s examine each one briefly. First, during the era of frontier expansion (1820-1880), a rapid westward movement occurred. Settlers were given the rare opportunity to acquire large amounts of good farmland in the “New World,” which pushed people out of the large cities like New York and Boston and towards the American Midwest into the future states of Ohio, Illinois, Iowa, Nebraska, etc. Many immigrants came to the US specifically in search of land, because population pressure in Europe made land acquisition very difficult. The Homestead Act of 1862 offered up to 160 acres of farmland to citizens or those planning to become citizens as long as they continuously lived on and farmed the land for five years. More than 1.5 million claims for land were made in subsequent years, resulting in a massive movement of people. It was also during this era that the transcontinental railroad was completed, linking the East Coast and West Coast for the first time in a meaningful way. Most immigrants during this time came from England, Scotland, Ireland, Germany, and Scandinavia. More than 1.5 million also came from Ireland in just a ten-year period (1845-1855) when the potato crop failed due to blight (disease), a period known as the Great Hunger. The only significant non-European immigrants arrived as a result of the BurlingameSeward Treaty of 1868, which welcomed Chinese workers, as China also opened its borders to American businesses, students, and missionaries. Migration from China was short-lived, however, during the subsequent era.
Phase 2 (1880-1910) ushered in a dramatic shift as the number of new arrivals soared to unprecedented levels. Moreover, the source countries also changed as immigrants began to arrive from southern and eastern European countries such as Italy, Greece, Russia, and Poland. American imagery, stories, legends, books, and films tend to focus heavily on this period, because it was the most intense era of movement from Europe, and most were arriving via Ellis Island by ship before settling into distinctly ethnic neighborhoods in cities across the US It was also an era of massive industrialization that demanded a large source of low-cost workers, which immigration provided. Coal mines, steel mills, and factories were growing at unprecedented levels as the US raced to “catch up” with the great cities of the world, building bridges, skyscrapers, museums, sports stadiums, and other large structures at unprecedented levels. The period also produced a new era of exclusion as the Chinese Exclusion Act of 1882 prohibited immigration, naturalization, and citizenship for anyone of Chinese descent, including those that had immigrated previously under legal means.
During Phase 3 (1910-1965), the US dramatically curtailed the number of immigrants permitted to enter the country legally. The great western settlement had ended, and high birth rates in the US created enough new workers to meet the demand of the continued industrialization of the country. A series of new exclusionary laws prevented all “Asiatic People” from entering the country, as American nationalism fanned by white power and eugenic movements sought to exclude and divide the people of the world into categories of “civilized,” “savage,” and “semi-civilized.” Also banned were “polygamists, anarchists, beggars, and importers of prostitutes.” (For an excellent graphical overview of US immigration legislation, visit the Pew Research Center website: http://www.pewhispanic.org/2015/09/2...ions-1790-2014). During this period, immigration levels declined precipitously as the country grappled with questions of heritage, identity, and cohesion. National legislation was crafted to maintain the racial and ethnic balance of the country as mistrust between nations erupted in two world wars. Quotas were established to allow immigration of only a limited number of people from specific European countries, while all others were kept out. Ellis Island closed its doors in 1954 after having processed more than 12 million immigrants. However, a dramatic social shift was on the horizon, as the 1960’s would dramatically alter US immigration in the coming decades.
Immigration into the US in the current era, Phase 4 (1965-Present), is characterized by (1) enormous growth and (2) a new diversity of source countries, dominated by the regions of Asia and Latin America. While the percent of foreign-born residents is similar to that of the early 1900’s, the 47 million (in 2016) living in the US represents an unprecedented historical high with one out of every four children having at least one parent who is an immigrant. The Immigration and Naturalization Act of 1965 dramatically shifted the nature of immigration into the US from one with low numbers from a handful of pre-determined countries to a system that favors those with particular skills (e.g. scientists, engineers, and doctors) and for family reunification. As more Americans entered college, demand for manual labor also grew. Jobs that were once done by children and teenagers, such as harvesting crops, cutting grass, or washing dishes in restaurants were increasingly being filled by immigrants willing to work long hours for little pay. Asian exclusion laws and quotas were abolished, as progressive civil rights era provisions took a “colorblind” approach to welcome those from all regions of the world as long as they had the skills and education that would benefit theAmerican economy. Laws also made it much easier for existing citizens to legally bring immediate relatives from abroad, so that families would not be divided by restrictive immigration policies. Speaking to a sparse crowd in 1965 about the new immigration bill, President Lyndon B. Johnson said, this “is not a revolutionary bill. It does not affect the lives of millions . . . It will not reshape the structure of our daily lives or add importantly to either our wealth or our power.”1 Yet in the three decades after its passage, more than 18 million people arrived legally, tripling the number of immigrants from the previous three decades. The “face” of immigration changed dramatically. In 2016, the largest number of foreign born were those from Mexico, China, India, the Philippines, and Vietnam. Moreover, immigrants are responsible for 25 percent of all new businesses and more than half of all start-up companies valued at more than $1 billion. Sometimes, Presidents are wrong.
3.3.4 Regional Migration Flows: Asia
Migration within Asia is difficult to summarize given the massive size and scope of a region with 4.4 billion people! However, if you revisit the world migration map (www.iom.int/world-migration ), you will notice that even the largest countries in the world (China and India) contain relatively-few foreign born people compared to those in Europe and North America. Can you think of reasons why this might be the case? The first explanation is simple. Large-scale human settlement and political development occurred much earlier than in Europe or in North America. Early Chinese civilizations had already emerged more than 5,000 years ago, and many in Asia can trace ancestral lineages back thousands of years as well. As such, Asia (for the most part) wasn’t “discovered,” conquered, orcolonized during the time of European imperialism. Apart from a small number of missionaries, entrepreneurs, and adventurers, Asia did not become a major destination for those from foreign lands (there are several notable exceptions, particularly in the case of the British Empire). Second, most Asian countries simply do not allow for permanent immigration, except in the case of marriage (which also can be a very slow and tedious process). Nonetheless, in the age of globalization and migration, more people are on the move in Asia in the twentyfirst century than ever before.
With a population of 1.3 billion and a fast-growing economy, China tends to dominate the East Asia region. The Chinese Diaspora is a term that refers to the 46 million people that identify themselves as Chinese but live outside of China, with the largest number making their homes in Southeast Asia and others in Australia, North America, or Europe. Many fled China during times of political instability before and after WWII and under early communist rule, but today, many of those who leave China are wealthy and educated and do so because their skills are in demand in other parts of the world.
The most significant movement of people anywhere in the history of the world has been taking place recently inside both China and India as rural farmers have been leaving the countryside and moving into cities. Nearly 200 million people have left the interior of China to re-settle and seek work in China’s dynamic cities, mostly located along the eastern part of the country. While they do not cross international borders, the distance and socioeconomic differences between rural and urban areas in China are very similar to an international move for many. The motivation is largely economic in that farmers can barely earn a few dollars a day in rural areas; new manufacturing jobs in coastal cities pay several times that.