9.2: Important Terms and Concepts
- Page ID
- 38695

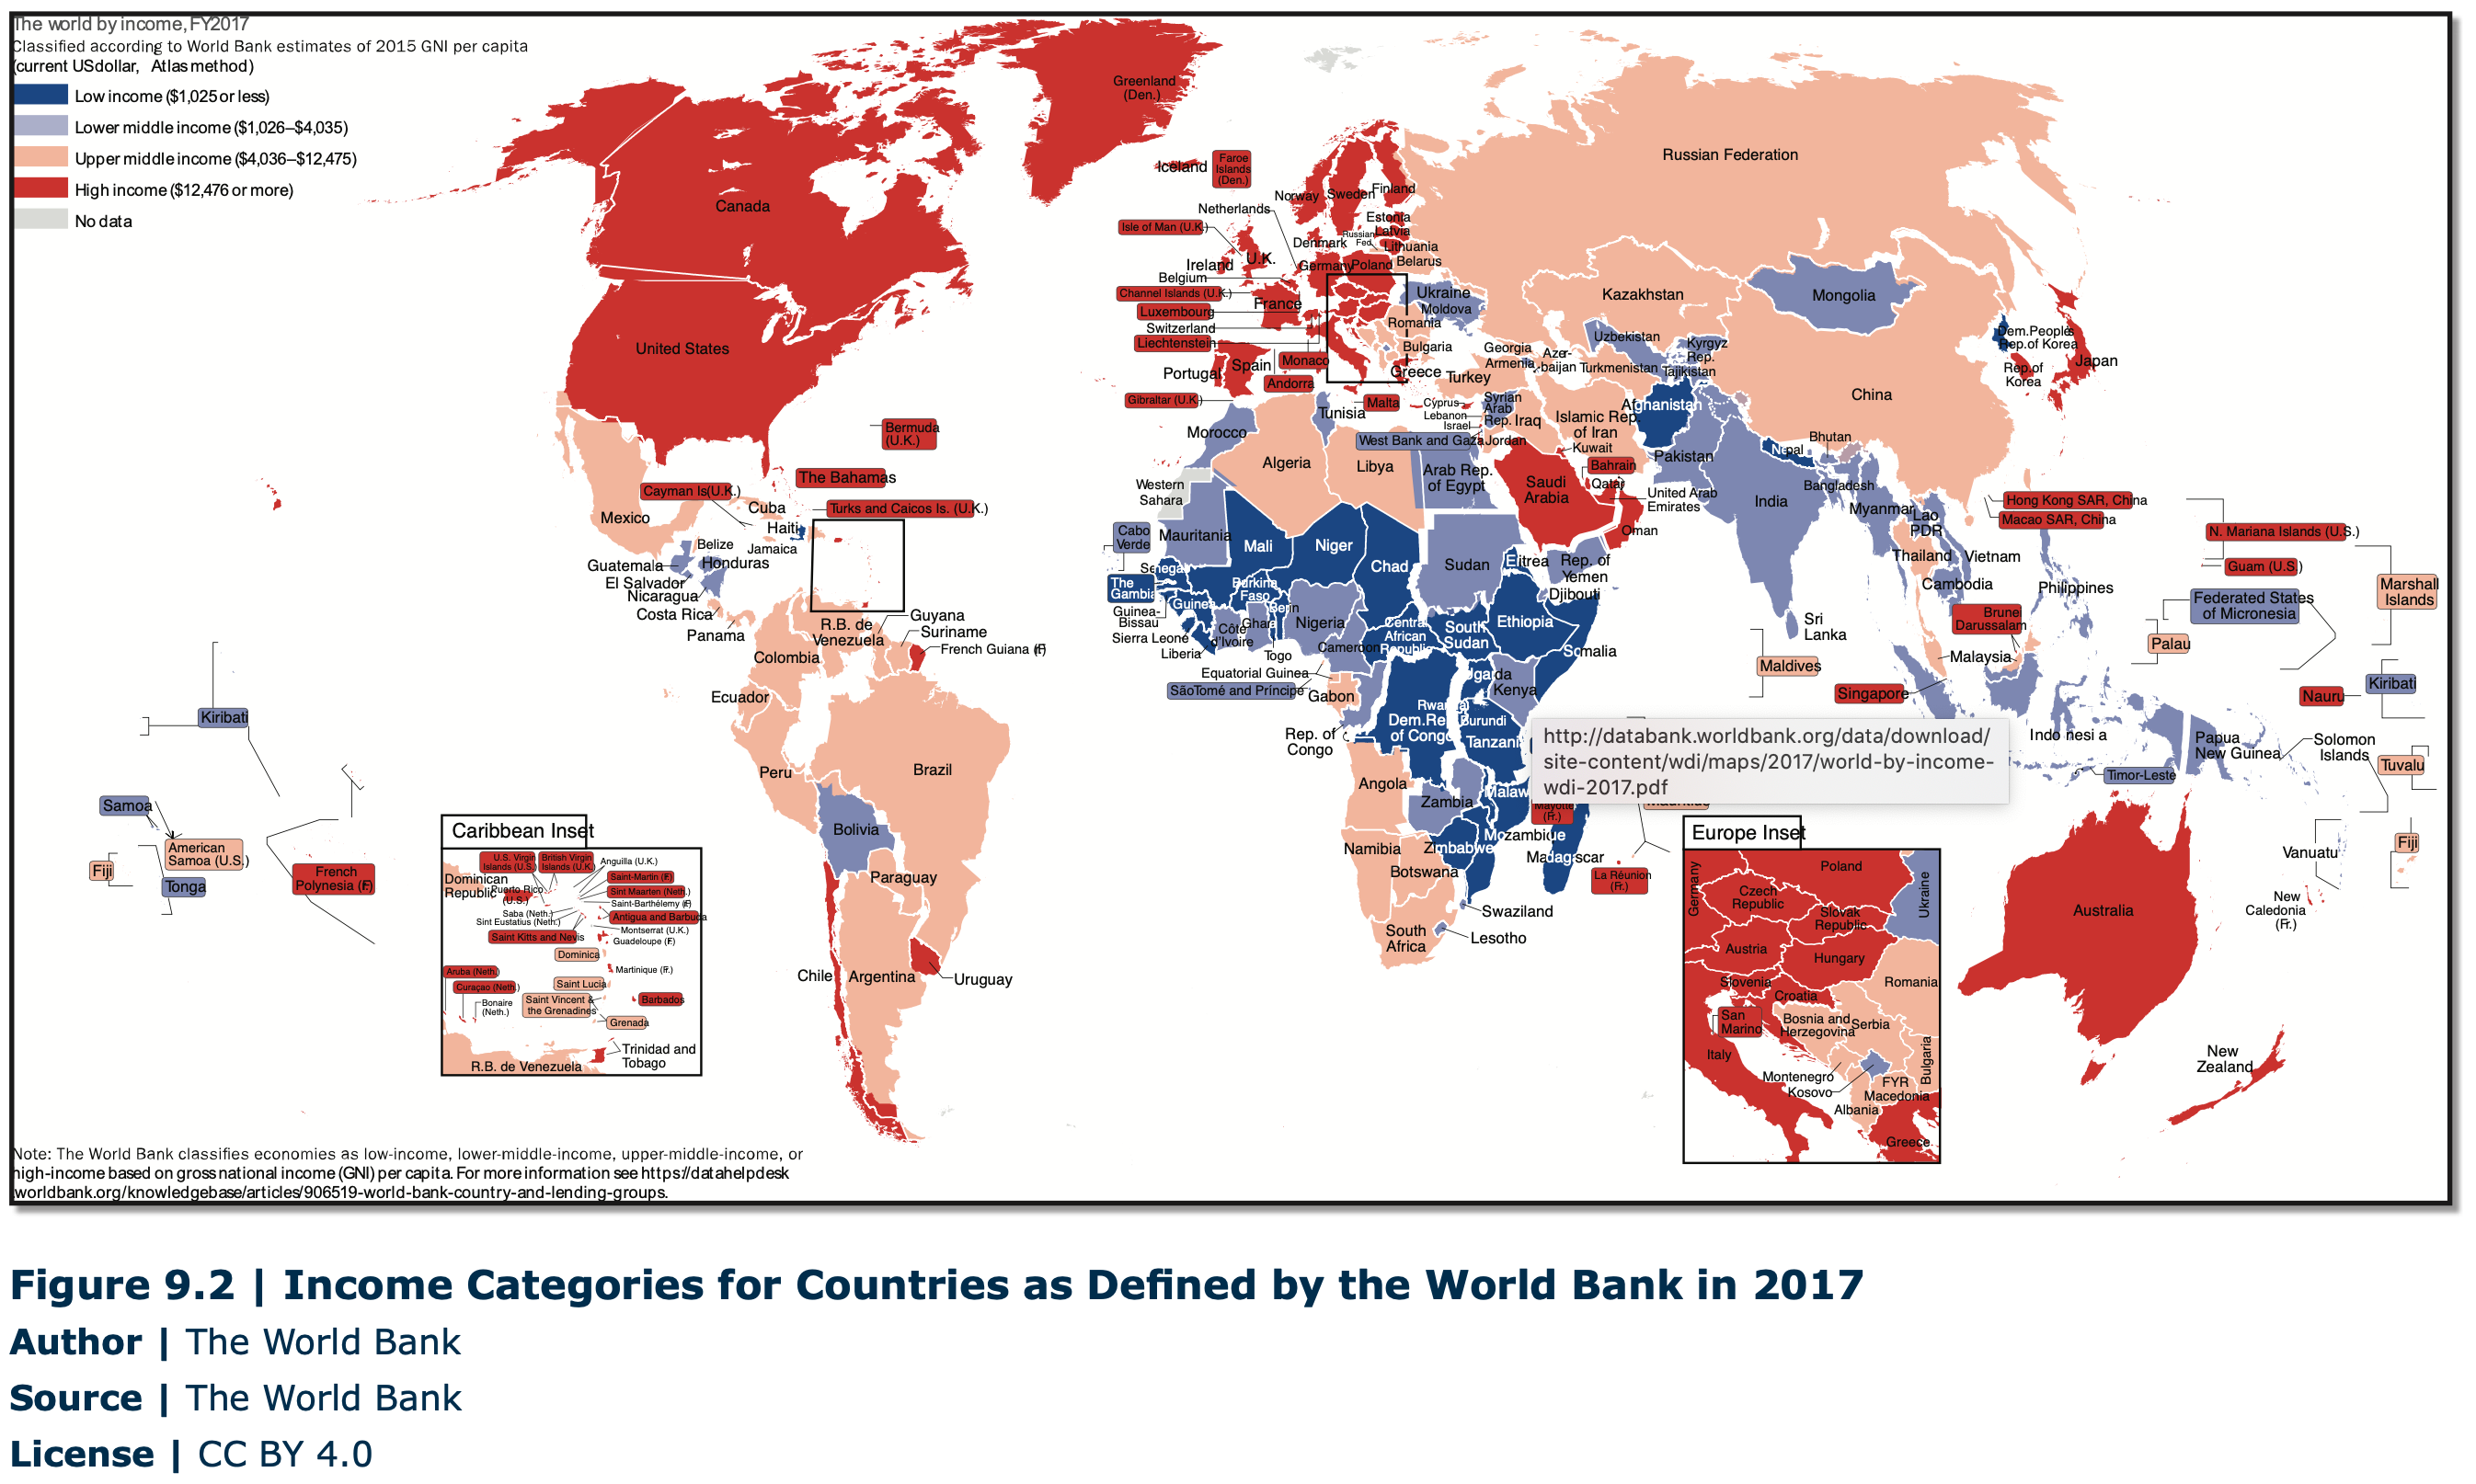
People in more developed countries (MDC) and less developed countries (LDC) experience the world very differently, but let’s think about the meaning of such terms. MDC’s tend to have higher incomes, levels of technology, infrastructure development, and life expectancies while LDC’s tend to have lower levels of those and other indicators. The simplest measure to consider is income. The World Bank (more on this institution later in the chapter) places countries into 4 categories. In 2017, low-income economies were defined as those with a gross national income (GNI) per capita, of $1,025 or less in 2016; lower middle-income economies are those with a GNI per capita between $1,026and $4,035; upper middle-income economies are those with a GNI per capita between $4,036 and $12,475; high-income economies are those with a GNI per capita of $12,476 or more. The map in Figure 9.2 displays the general geographic patterns associated with the 4 categories. Take a moment to look at the map to see if any of the countries or regions surprise you. For example, are all African countries in the same category? What about countries in Latin America or Asia? Which country is in a higher category, China or Russia?
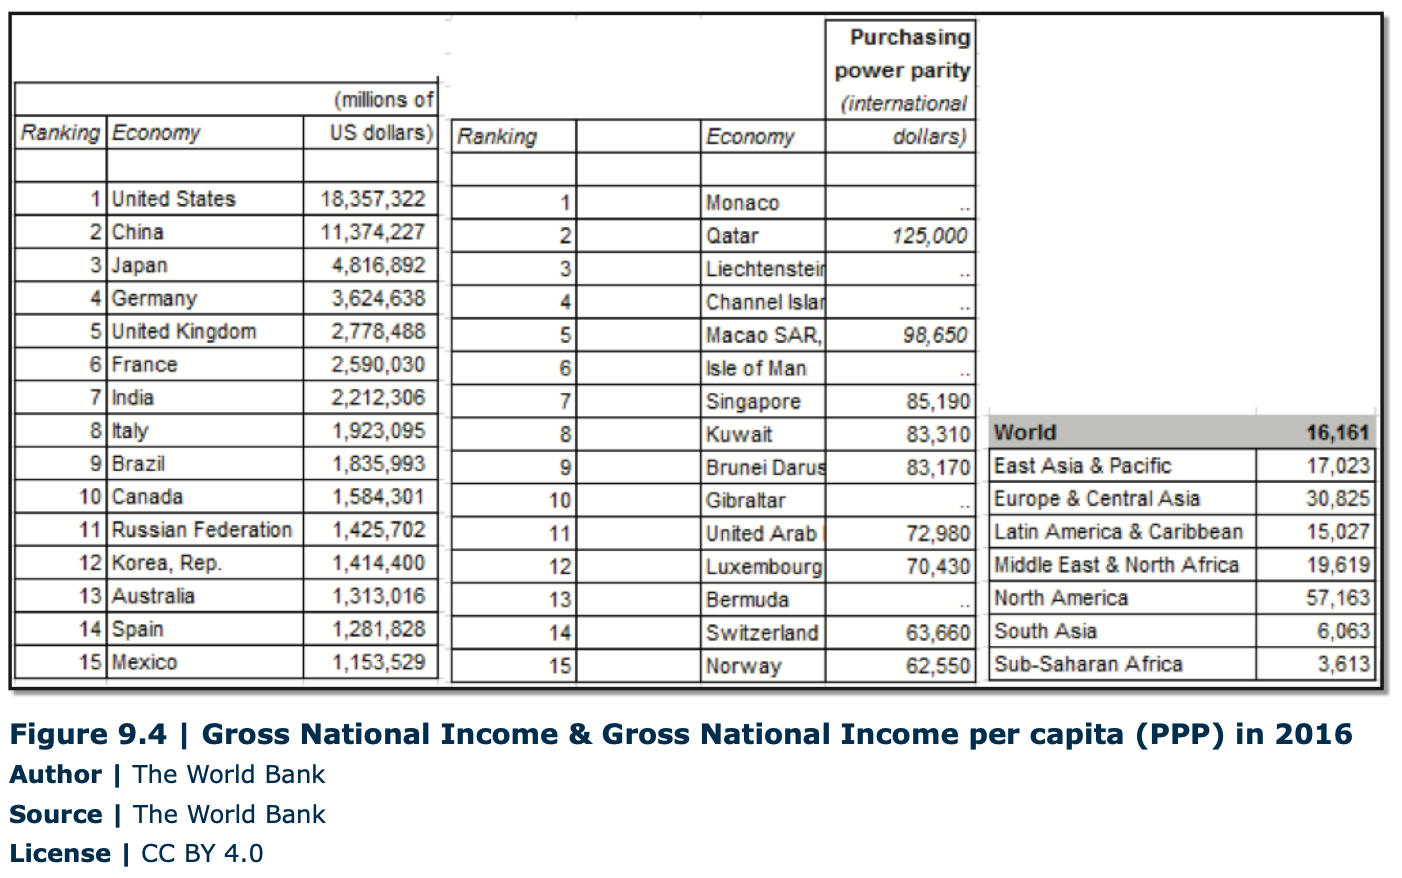
Now that you have pondered these categories and spatial patterns, let’s take a step back. What exactly is meant by Gross National Income per capita? It is the sum of a nation’s gross domestic product (GDP) and the net income it receives from overseas. GDP includes all of the goods and services produced with a country in a given year and is calculated according to the following formula: Consumption + Investment + Government Spending + Net exports. So if a government increases spending on the military or on road construction in a given year that will increase GDP (and GNI). If a country imports a lot of things but doesn’t export many things, it will decrease that country’s GDP (and GNI). Finally, if consumers buy a lot of alcohol for New Year’s Eve, that will also increase GDP(and GNI). GNI also includes income derived outside of the country by members of the country. For example, Coca Cola, headquartered in Atlanta, Georgia, earns profits in 200 different countries around the world. Those profits outside of the U.S. are not included in GDP, but they are included in GNI. It’s a little confusing, but this measure provides a valuable way to compare economic outputs between multiple countries and is the metric that is most often used in recent years. The total GNI for a country is divided by the total population of that country to arrive at a per capita figure, which includes children, the elderly, those imprisoned, etc. So, the figure of $12,476 does NOT mean that the average adult earns that amount annually as income, but rather it represents total income and economic output divided by the total population. Take a look at the cartogram in Figure 9.3, which shows countries represented, not by their physical size, but by the size of their respective GNI. Table 11.2 shows the top 15 countries by GNI, with the United States ranked at the top and China second. The next table shows countries ranked according to GNI per capita (per person). Notice how the list of the top 15 countries changes dramatically. Can you think of reasons to explain why this might be? First, small oil-producing countries tend to have high incomes that are spread across a small population (e.g. Qatar, United Arab Emirates, Brunei). Second, countries with high incomes, high exports, and few children (e.g. Singapore and Switzerland) have high GNI. Third, certain small countries attract very wealthy member of society to live there in order to avoid paying higher tax rates elsewhere (e.g. Switzerland, Isle of Man, and Bermuda).
The difference between GNI and GNI per capita tends to be more pronounced in large, highly populated countries. The U.S. and China, for example, are the top two countries for total GNI, but neither appears in the top 15 for GNI percapita, in which the U.S. ranks 18th ($58,700 per person) and China drops all the way to 103 ($15,500 per person). A final important term useful to understand economic differences is Purchasing Power Parity (PPP). The PPP accounts for differences in the cost of living and goods between 2 places to allow for a more meaningful comparison. Think about it this way. If you earned $60,000 per year in New York City or in Lincoln, Nebraska, where would your salary be more valuable? Most items are cheaper in Lincoln, so your salary would be worth more there than in NYC. Similarly, the cost of living in Mexico is much lower than in Sweden, so the PPP figures in Table 11.1 account for such differences. If you are considering a move, you can check on salary equivalencies here: money.cnn.com/ calculator/pf/cost-of-living/index.html.