
8.4: South Asia's Population Dynamics
- Page ID
- 21098

South Asia is the most populous region on Earth, but why is it the most populous, and how do geographers study population? The simplest way to measure population is to count the number of people in an area. India, for example, has a population of over 1.3 billion, making it the second-most populous country after China. But do raw numbers of people tell the whole story of the human population in an area? If two countries have the same population, but one is far smaller than the other, how could we examine population in a way that explores this difference?
Geographers often use the concept of density to investigate population. Arithmetic density is fairly easy to calculate. It is determined by simply taking the number of people in an area divided by the size of the area. If a territory was one kilometer square, for example, and was home to 100 people, the arithmetic density would be 100 people per square kilometer. Although arithmetic density is easy to calculate, it gives us a fairly limited view of population density. What if there are two tracts of land that are the same size and have the same number of people, but one is lush and fertile and has people spread out evenly and the other has a tiny river that everyone lives near? If you were using arithmetic density, the measurements for these two areas would be the same even though the actual settlement patterns are quite different (Figure \(\PageIndex{1}\)). Physiologic density takes into account this difference by examining the number of people per unit of arable, or farmable, land.
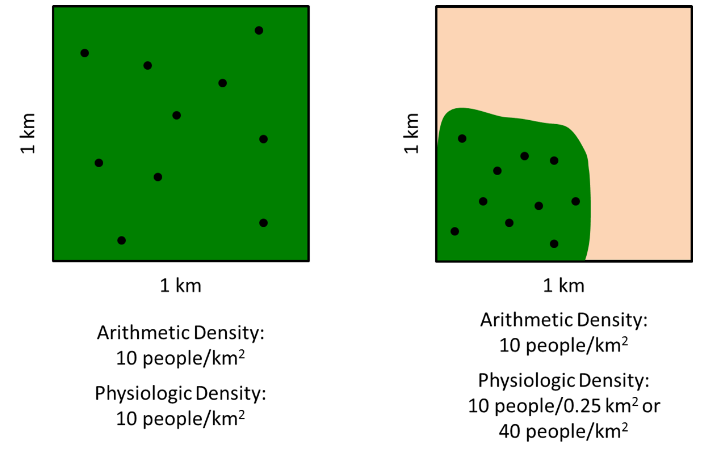
Arithmetic and physiologic density can give us insight into the concentration of a country’s population and allows us to make comparisons between countries. The United States, a fairly large country, for example, has an arithmetic density of 32 people per square kilometer. However, a relatively small percentage of US land is arable, so the physiologic density is 179 people per square kilometer. Bhutan, by comparison, has a low population density of only 14 people per square kilometer. However, its rugged mountain environment means that only around 2 percent of the land is farmable, so its physiologic density is 606 people per square kilometer. By most measures, the most densely populated place in the world is Singapore with an arithmetic density of 6,483 people per square kilometer and a physiologic density of 441,000 people per square kilometer.
Another way to measure population is agricultural denisty which is the ratio of the number of farmers to the area of land. In developing countries where many people work as farmers, agricultural density is very high. South Asia has a high agricultural density. In developed countries, commercial agriculture and technological innovations have allowed relatively few people to be farmers and agricultural densities are generally low.
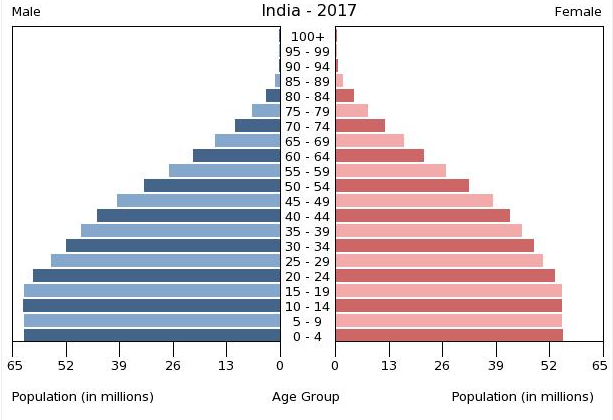
Geographers can also examine how a population is growing and changing over time. One way to explore this is with a population pyramid, a graphical representation of a population’s age groups and composition of males and females. Ages of people are grouped in cohorts with younger people on the bottom and older on the top. Thus, a population pyramid that is very triangular has a lot of young people and is growing rapidly.
Typically, the ratio of males to females, known as the sex ratio, is 1 to 1 and population pyramids will have even sides. However, in populations where males are favored, the ratio may be skewed. Similarly, in countries where men have died in war, such as in World War II Germany, there might be more females. When geographers and population demographers refer to sex, it means something different from gender; sex is a person’s biological identity as male or female while gender refers to a person’s role as a “man” or “woman” within society.
India’s 2017 population pyramid reveals rapid population growth over the past few decades (Figure \(\PageIndex{2}\)). However, the leveling off at the base of the pyramid indicates that population growth may be slowing. In addition, India’s cultural preference for male children is clearly apparent. Among children aged zero to four, India has 62 million males and only 55 million females. Nationwide, there are over 47 million more males in India than females. Both abortion and infanticide have contributed to this imbalance.
All of the population pyramids for the countries in this region reveal preferences for male children, though none are as severe an imbalance as India. Although Pakistan’s population growth has slowed in the past decades, its fertility rate remains the highest in the region at around 3.5, meaning a woman in Pakistan, on average, will have 3.5 children.
- Arithmetic density:
-
the number of people in an area divided by the size of the area
- Physiological density:
-
the number of people per unit of arable land
- Agricultural density:
-
the ratio of the number of farmers to the area of land
- Population pyramid:
-
a graphical representation of a population’s age groups and composition of males and females
- Sex ratio:
-
the ratio of males to females in a population