Social Sci LibreTexts

6.7: High School Dropouts

  • Page ID
    10530
  • \( \newcommand{\vecs}[1]{\overset { \scriptstyle \rightharpoonup} {\mathbf{#1}} } \) \( \newcommand{\vecd}[1]{\overset{-\!-\!\rightharpoonup}{\vphantom{a}\smash {#1}}} \)\(\newcommand{\id}{\mathrm{id}}\) \( \newcommand{\Span}{\mathrm{span}}\) \( \newcommand{\kernel}{\mathrm{null}\,}\) \( \newcommand{\range}{\mathrm{range}\,}\) \( \newcommand{\RealPart}{\mathrm{Re}}\) \( \newcommand{\ImaginaryPart}{\mathrm{Im}}\) \( \newcommand{\Argument}{\mathrm{Arg}}\) \( \newcommand{\norm}[1]{\| #1 \|}\) \( \newcommand{\inner}[2]{\langle #1, #2 \rangle}\) \( \newcommand{\Span}{\mathrm{span}}\) \(\newcommand{\id}{\mathrm{id}}\) \( \newcommand{\Span}{\mathrm{span}}\) \( \newcommand{\kernel}{\mathrm{null}\,}\) \( \newcommand{\range}{\mathrm{range}\,}\) \( \newcommand{\RealPart}{\mathrm{Re}}\) \( \newcommand{\ImaginaryPart}{\mathrm{Im}}\) \( \newcommand{\Argument}{\mathrm{Arg}}\) \( \newcommand{\norm}[1]{\| #1 \|}\) \( \newcommand{\inner}[2]{\langle #1, #2 \rangle}\) \( \newcommand{\Span}{\mathrm{span}}\)\(\newcommand{\AA}{\unicode[.8,0]{x212B}}\)
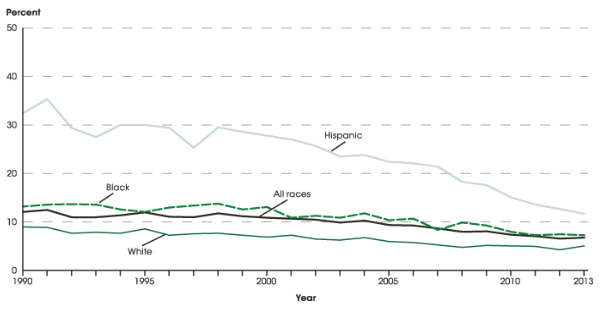
    The status dropout rate refers to the percentage of 16 to 24 year-olds who are not enrolled in school and do not have high school credentials (either a diploma or an equivalency credential such as a General Educational Development [GED] certificate). The dropout rate is based on sample surveys of the civilian, noninstitutionalized population, which excludes persons in prisons, persons in the military, and other persons not living in households. The dropout rate among high school students has declined from a rate of 12% in 1990, to 7% in 2013 (U.S. Department of Education, 2015). The rate is lower for Whites than for Blacks, and the rates for both Whites and Blacks are lower than the rate for Hispanics. However, the gap between Whites, Blacks, and Hispanics have narrowed (see Figure 6.11).

    Screen Shot 2019-01-16 at 5.41.17 PM.png
    Figure 6.13: Status dropout rates of 16- through 24-year-olds, by race/ethnicity: 1990 through 2013. SOURCE: U.S. Department of Education, National Center for Education Statistics. (2015). The Condition of Education 2015 (NCES 2015-144), Status Dropout Rates.

    The dropout rate for males in 1990 was 12%, where it stayed until 2000. Thereafter the rate has dropped to 7% in 2013. The dropout rate for females in 1990 was 12%, where it dropped to 10% in 2000, and in 2013 was 6%. From 1997 until 2012 the rate for males was appreciably higher than for females, while in 2013 the gender difference was minimal (U.S. Department of Education, 2015).


    This page titled 6.7: High School Dropouts is shared under a CC BY-NC-SA 3.0 license and was authored, remixed, and/or curated by Martha Lally and Suzanne Valentine-French via source content that was edited to the style and standards of the LibreTexts platform; a detailed edit history is available upon request.