
9.1: Chapter 57- Voting
- Page ID
- 73498

Who Tends to Vote?
Voting matters, even in an attenuated democracy. Every two years we have a federal election during which we decide who is going to occupy all 435 House seats and one-third of the 100 Senate seats until the next federal election. Obviously, this election has enormous implications for legislation that passes Congress. Every four years, we have a federal election for president and vice president, which has many implications for judicial nominations, the prosecutorial discretion of the Justice Department, and the extent to which the new administration will or will not aggressively implement environmental, worker and consumer safety, and economic regulations, as well as how responsive the federal government is to national emergencies like the COVID-19 pandemic and natural disasters.
There are a couple of things you should know about voting turnout in the United States. First, American voting turnout is not particularly high. Second, it bounces around depending on whether we’re talking about a presidential election year or what’s known as a midterm election. A presidential election year is one in which we elect the president. A midterm election year is one in which presidential candidates—technically, the slates of electors pledged to presidential candidates—are not on the ballot. From 1980 to 2016, voting turnout in presidential election years averaged just shy of 57 percent, meaning that for every 100 people who were of voting age, only 57 did so. From 1982 to 2018, voting turnout in midterm elections averaged just under 41 percent. (2) By international standards, voter turnout in the United States is lower than most countries to which we’d like to be compared. While we are very proud of ourselves when turnout in a presidential election year breaks 60 percent, turnout in the most recent elections around the world put America to shame: the UK 63 percent, France 67 percent, Germany 69 percent, New Zealand 76 percent, Denmark 80 percent, and Belgium 87 percent. (3)
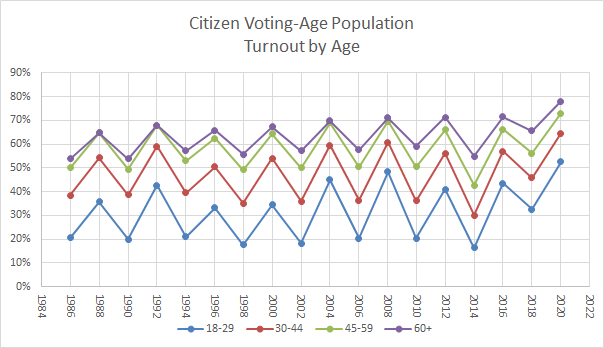
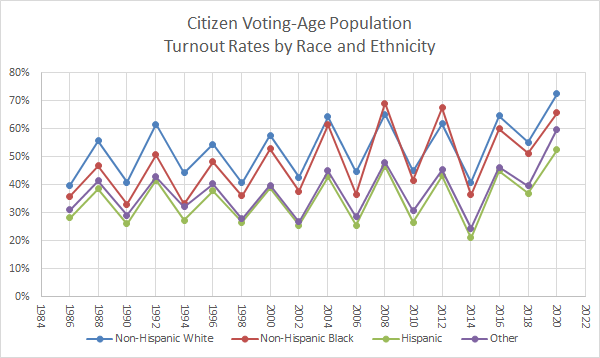
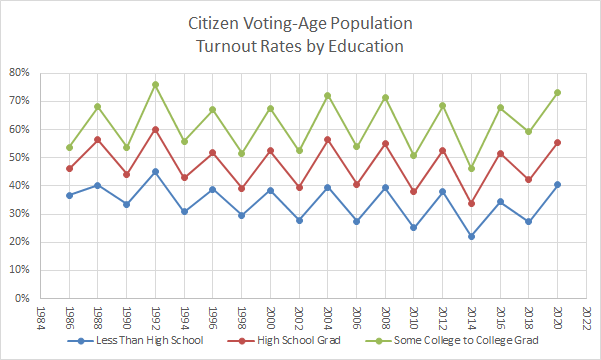
Can we make some useful generalizations about the people who do tend to turnout in American elections? Yes, there are some informative things we can say, but keep in mind that demographic variables correlate with each other. (4) Race and ethnicity appear to be relevant. Consider that in the last presidential election, 65 percent of Whites voted, 60 percent of Blacks voted, and 45 percent of Hispanics voted. That ranking generally holds true over time, although the Black turnout rate did eclipse that of Whites in the 2008 and 2012 presidential elections. It is also true that the Hispanic voting turnout rate has been increasing over time—in 1996 Hispanic turnout was only 38 percent. Age is a strong and consistent predictor of voter turnout. As age increases, tendency to vote increases. In the last presidential election, 43 percent of eighteen- to twenty-nine-year-olds voted, 57 percent of thirty- to forty-four-year-olds voted, 66 percent of forty-five- to sixty-four-year-olds voted, and 71 percent of people sixty years and older voted. This age ranking holds true in all recent elections. Finally, we should note that formal education correlates with tendency to vote. In the last presidential election, only 31 percent of people without a high school diploma voted, while 85 percent of people with a graduate degree voted. This pattern holds at every increased level of education: high school graduates vote at higher rates than those who didn’t finish high school; people with college degrees vote at higher rates than high school graduates, and so on. Let’s look at these relationships over time thanks to Professor Michael P. McDonald and the United States Elections Project at the University of Florida:
Who Tends to Vote for Which Party?
In this section, we want to make some generalizations about how different demographic groups tend to vote. If there’s one thing we know about political preferences in American politics, it is that they change over time. The patterns we’ll describe are real—that is, supported by public opinion and exit polling data—but they might not have existed in the past and they might change going forward. Still, understanding voting patterns can help you make sense of contemporary political news. Let’s keep another thing in mind as well. These are only tendencies. Each person makes up their own mind how to vote, and there’s a chance that they will not conform to the patterns described below. Just because you happen to fall into a demographic group that tends to vote for one political party, it doesn’t mean you can’t be perfectly happy voting for a different one.
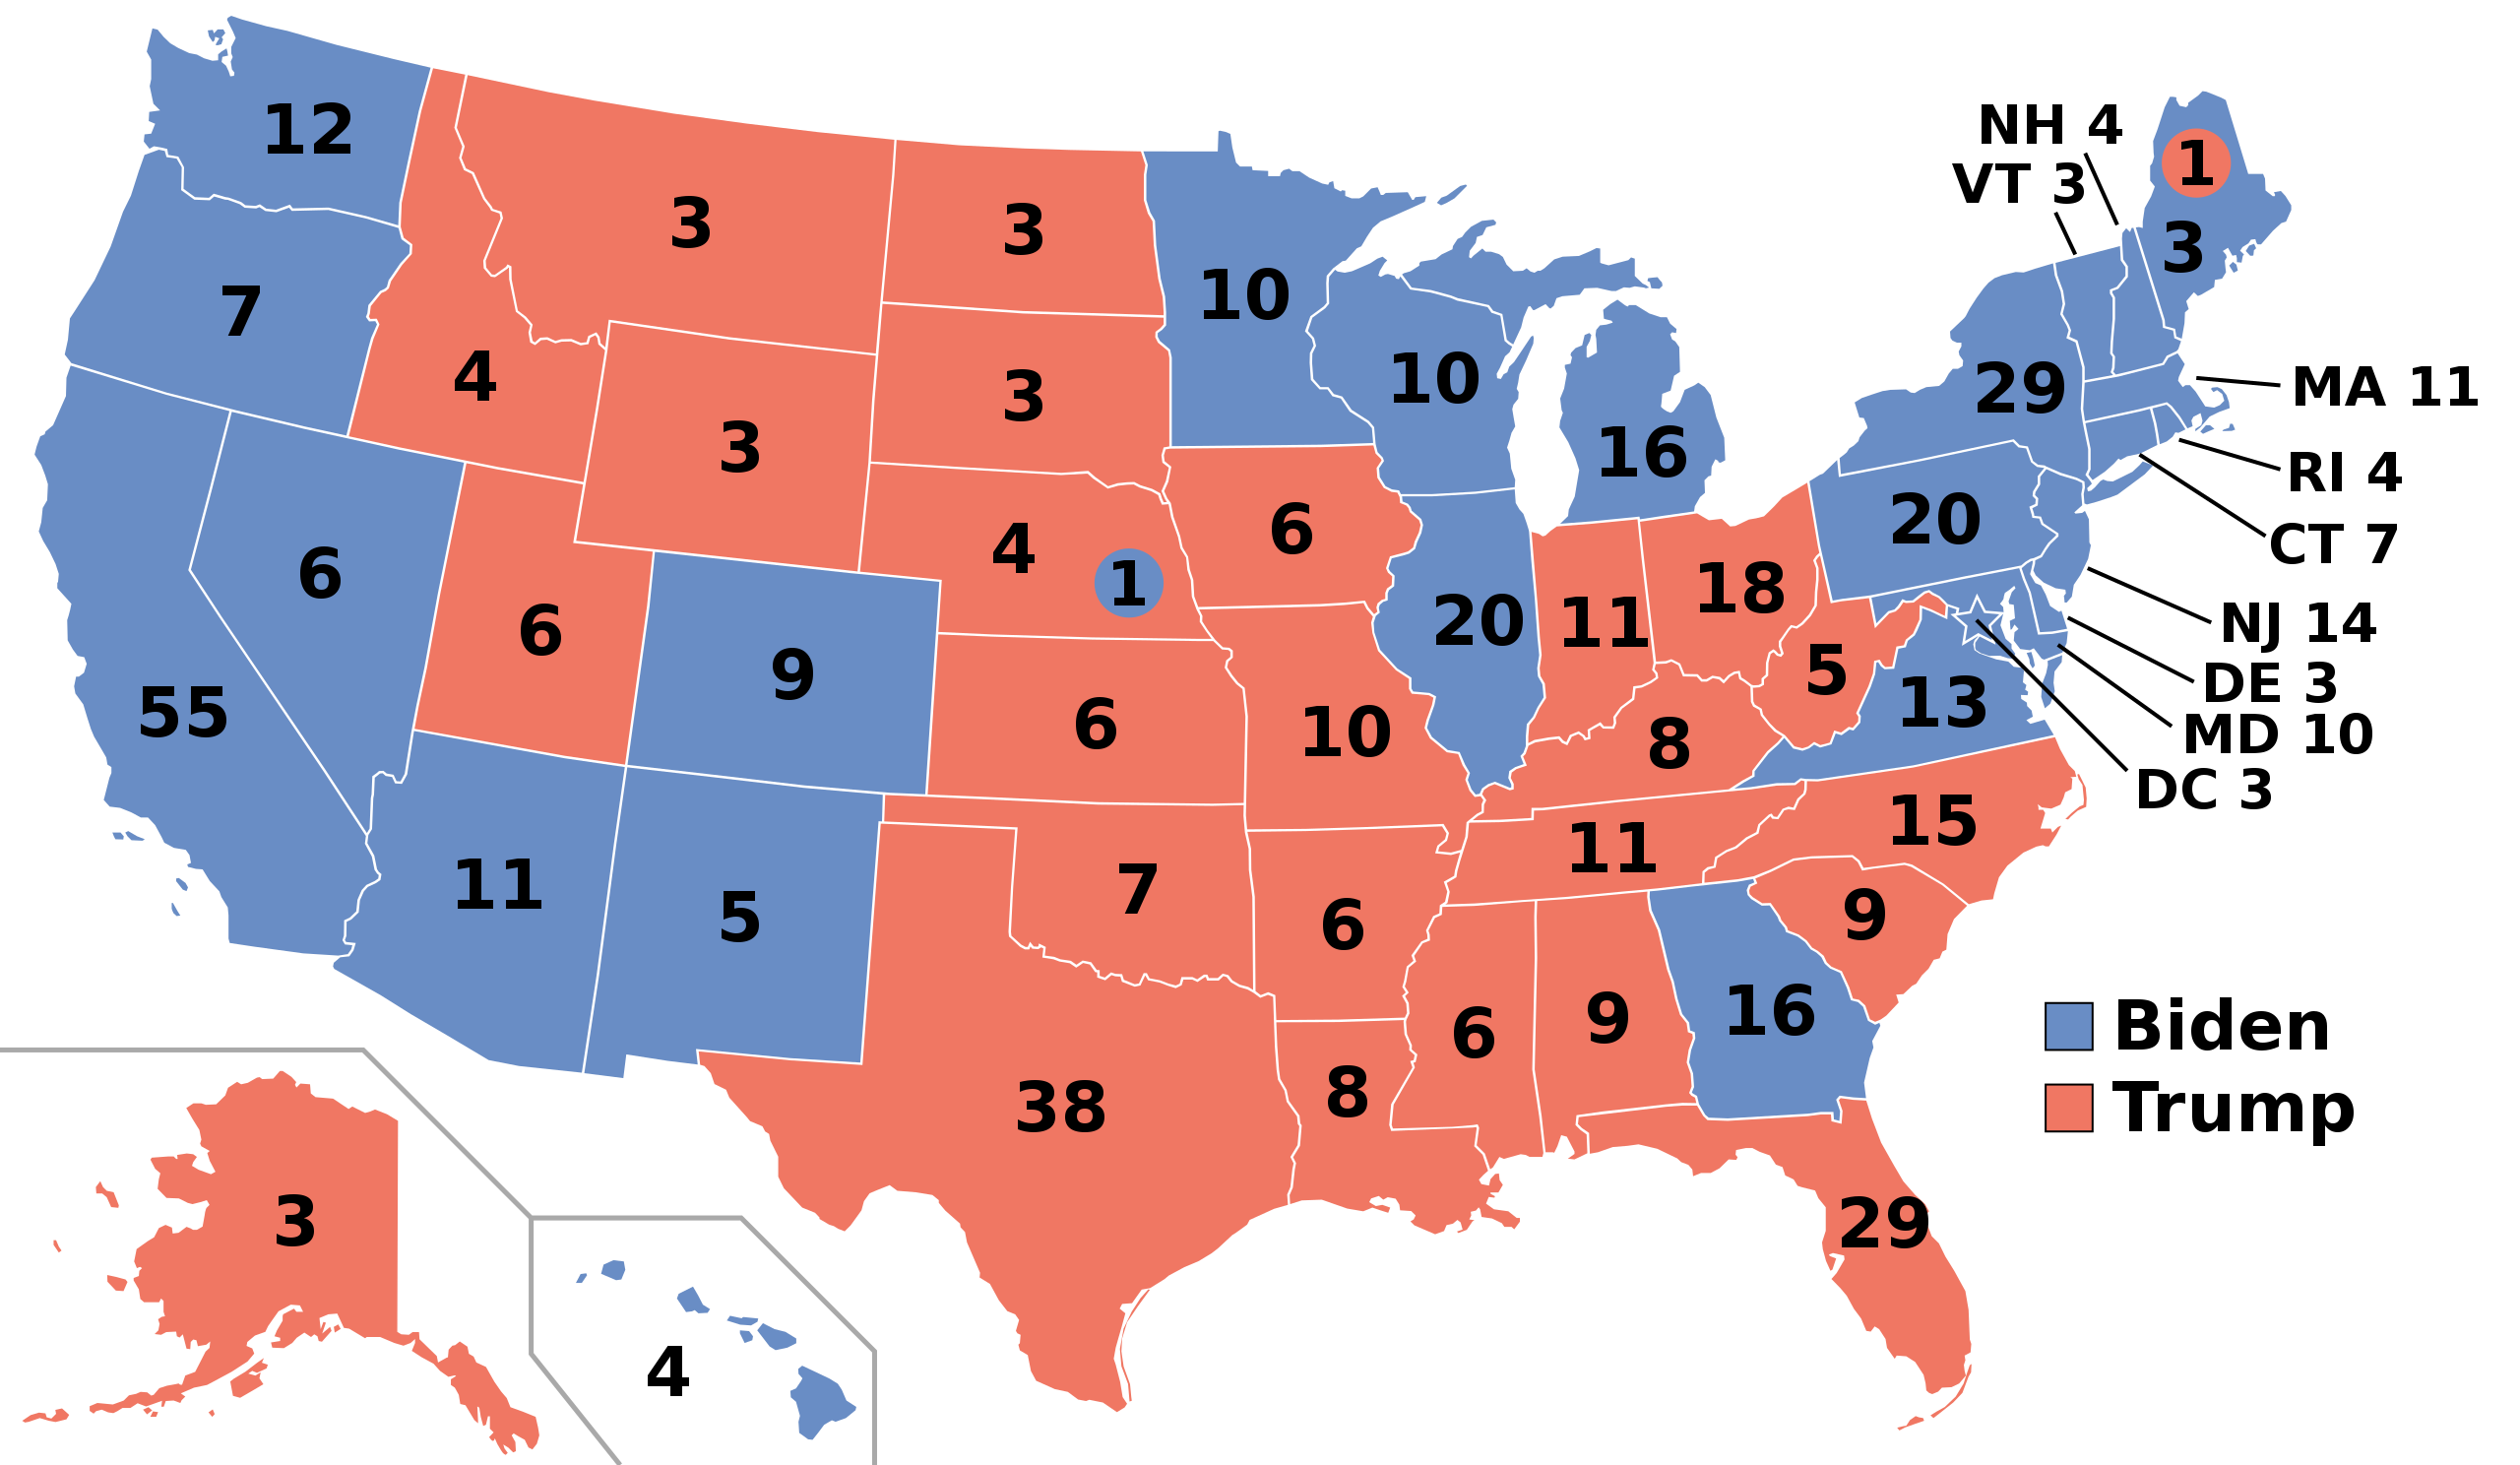
Race and Ethnicity has a clear impact on tendency to vote Republican or Democratic: In general, Whites tend to vote Republican, and ethnic minorities vote Democratic—although there are exceptions and matters of degree. In the 2020 election, according to CNN exit polls, Republican Donald Trump beat Democrat Joe Biden among Whites by 17 percentage points—58 percent to 41 percent. Biden beat Trump among Blacks by a remarkable 75 percentage points—87 percent to 12 percent. Biden beat Trump by 65 percent to 32 percent among Hispanics and by 61 percent to 34 percent among Asian Americans. (5) These results are not surprising, as they track pre-election party identification. For example, 84 percent of Blacks and 63 percent of Hispanics identified with the Democratic party. Whites were about 8 percentage points more likely to identify as Republican leading up to the 2020 election. (6) One of the most interesting aspects of the Trump years is that the Republican Party saw significant gains among Hispanic voters. (7) Why do we see party identification and voting patterns among racial and ethnic groups in the United States?
The gender gap is currently one of the most interesting demographically driven voting pattern that gets noticed in the media. The gender gap refers to women’s tendency to vote for Democratic candidates and men’s tendency to vote for Republican candidates. The gender gap didn’t used to exist. Women won the right to vote in 1920, and for many decades afterwards there wasn’t really a noticeable difference between women and men’s voting preferences. Gender-based voting preferences began to change in the 1970s but became fully noticeable with the 1980 election. The gap has grown ever since and continues to fit the pattern of women voting more Democratic and men voting more Republican. There was an 8 percentage point male-female gap in the 1980 presidential race, a 12 percentage point male-female gap in the 2000 presidential race, a 13 percentage point male-female gap in the 2016 presidential race, and a 14 percentage point male-female gap in the 2020 presidential race. (8) Why did the gender gap arise in the 1970s and 80s, and why does it persist? Think about issues on which men and women might differ. Think also about the conservative and progressive tenets described earlier in the text. How long do you think the gender gap will persist in American politics?
Religious denomination and overall religiosity are important demographic factors in party identification and voting. Evangelical Christians—those belonging to more fundamentalist, White Protestant denominations—voted 76 percent to 24 percent for Trump over Biden in 2020. Mormons are similarly more likely to vote for Republican presidential candidates. Catholics were fairly evenly split in 2020, with a slight tilt toward Biden, who is Catholic. Jews are more likely to identify as Democrats. Religiosity—the extent to which a person is devout and practices their religion by going to religious services—also plays a role in voting. Christians who regularly attend church services are more likely to identify as Republican. People who say they are religiously unaffiliated are significantly more likely to identify as Democratic. (9) Why do we see these differences in voting and party identity between different religious denominations and religiosity levels? What issues might be relevant to particular denominations, or be perceived differently by those who do and do not regularly attend religious services? What about the relevance of conservative and progressive tenets?
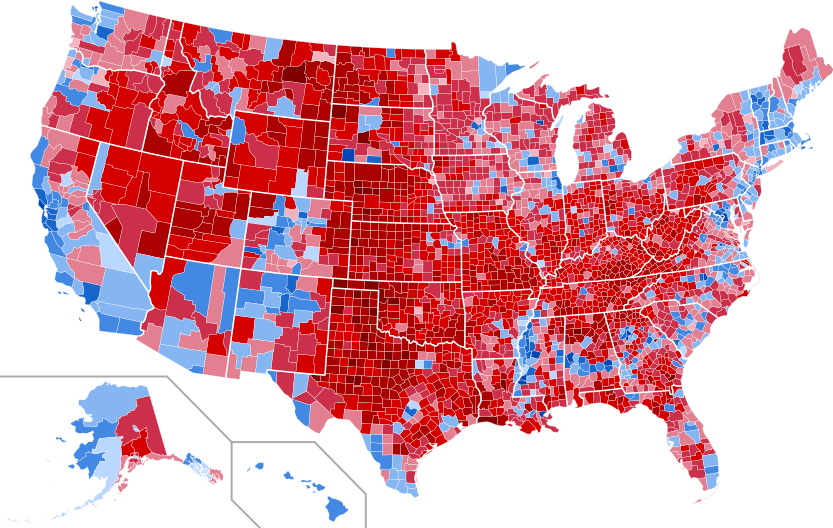
The United States has a pronounced urban/rural divide in voting. The generalization to be made here is that urban areas tend to vote Democratic, rural areas tend to vote Republican, and suburban areas are more likely to be battlegrounds that could go either way. Compare the county-level election results in 2020 with the state-level results, and you can see that rural counties tend to vote Republican and urban counties tend to vote Democratic–although there are exceptions like in Alaska and south Texas. According to exit polls in 2020, voters in urban areas supported Democrat Joe Biden by 60 percent to 38 percent, while voters in rural areas supported Republican Donald Trump by 57 percent to 42 percent—almost a mirror image. The suburbs went for Biden by just 2 percentage points. Party identity also mirrors this urban/rural divide. (10) Why do we see these geographic voting-pattern differences in the United States? What issues are perceived differently in urban and rural America? How might a person’s geographic identity interact with some of the other demographic variables discussed above?
What If. . . ?
What if we had nationwide, mail-in balloting for all federal elections? Democrats have introduced legislation in Congress to do just this, but Republicans oppose it. As of this writing, five states have universal mail-in balloting, but most do not—although many states allow mail-in balloting in certain elections or in certain circumstances such as absentee voting.
David Roberts, who lives in a state that has mail-in balloting, described the process.
I got my ballot in the mail several weeks before the election. One night the following week, after dinner, my family gathered around the dining room table. On one side, we had our ballots. On the other, we had Washington state’s official voter guide, along with several informal voting guides from some of our favorite publications and people.
We went through the ballot vote by vote — president, governor, on down to ballot initiatives on carbon taxes and public transit — discussing the opposing arguments, allowing the boys (11 and 13) to ask questions. Overall, it took about an hour. When we were done, we put our ballots in a special envelope, affixed stamps, and dropped them in the mailbox. That’s it.
We did this at our leisure, not during proscribed hours. We weren’t subject to the vagaries of weather or the idiosyncrasies of polling staff. We didn’t have to show any ID or wait in any lines. We had plenty of time to research and mull over each vote.
It felt deliberative, civilized, like the way human beings ought to vote. (11)
References
- Winston Churchill on the floor of Parliament in November, 1947. Kevin Robillard, “10 Great Quotes About Voting,” Politico. November 1, 2012.
- Author’s calculations from figures on the University of Florida’s United States Elections Project.
- Drew Desilver, “The U.S. Trails Most Developed Countries in Voter Turnout,” Pew Research Center. May 21, 2018.
- All figures in this paragraph come from the University of Florida’s United States Elections Project.
- Exit Polls, CNN, 2020.
- No Author, “Trends in Party Affiliation Among Demographic Groups,” Pew Research Center. March 20, 2018.
- Tim Alberta, “Why Democrats are Losing Hispanic Voters,” The Atlantic. November 3, 2022.
- Derek Thompson, “Why Men Vote for Republicans, and Women Vote for Democrats,” The Atlantic. February 9, 2020. Figures from 2020 from CNN exit polls.
- Exit Polls, CNN, 2020. No Author, “Trends in Party Affiliation Among Demographic Groups,” Pew Research Center. March 20, 2018.
- Exit Polls, CNN, 2020. No Author, “Trends in Party Affiliation Among Demographic Groups,” Pew Research Center. March 20, 2018.
- David Roberts, “Voting by Mail is Fair, Safe, and Easy. Why Don’t More States Use It?” Vox. May 27, 2017.
Media Attributions
- Voter Turnout Age 2020 © Michael P. MacDonald is licensed under a Public Domain license
- Voter Turnout Race 2020 © Michael P. MacDonald
- Voter Turnout Education 2020 © Michael P. MacDonald is licensed under a Public Domain license
- 2020presidential_election_results_by_county.svg © Magog the Ogre is licensed under a CC BY (Attribution) license
- 2020 Electoral College © Kingofthedead is licensed under a Public Domain license