Learning Objectives
By the end of this section, you will be able to:
- Remember that variables can be categorized as discrete or continuous
- Differentiate between discrete and continuous variables
Variables are objects that vary or change. Variables vary because of their inherent properties, by nature, or by manipulation. Let’s explore each of these in turn. Variables may hold inherent properties that make them vary. For example, let’s explore political efficacy. Political efficacy is a complex concept (Atabey and Hasta 2018), but it boils down to your belief that you can understand politics, influence a political institution, and that the political institution will be responsive to your concerns.
Political efficacy can be high, medium, or low. If, for example, you had a high understanding of politics, a strong belief that you can influence a political institution, a high expectation that a political institution would be responsive to your concerns, then you would have high political efficacy. On the other hand, you would have low political efficacy if you had little understanding of politics, a weak belief that you can influence an institution, and low expectations about institutional responsiveness. How can we measure political efficacy beyond using the high, medium and low categories?
Variables can be placed into two categories: discrete and continuous. Discrete variables can have values which we can count. For instance, a discrete variable can be -2, -1, 0, +1, +2, and so forth. On the other hand, continuous variables have values which we can specifically measure. In this case, a continuous variable can be zero, 0.1, 0.2, 0.3, 0.4, 0.5, and so forth. Within these two categories, exists two additional variable types. Discrete variables can have nominal and ordinal values. While continuous variables can have interval and ratio values. These are discussed in a later chapter.
What’s one way we can visualize discrete and continuous variables? Below in Figure #.1, there are three panels. Panel 1, which visually represents two discrete variables. Both the independent variable and the dependent variable have two values: no or yes. Given that we can count no (“0”) and yes (“1”), we would consider this a discrete set of variables. Let’s consider the following example. Our independent variable is “Registered to Vote” has two values: not registered to vote (“No”) or registered to vote (“Yes”). Our dependent variable is “Voted in the prior Presidential election” and has two values: did not vote in the prior presidential election (“No”) and did vote in the prior presidential election (“Yes”).
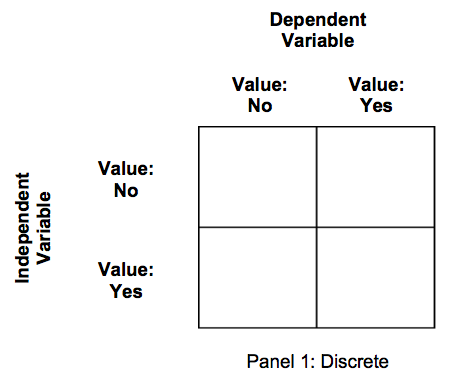
Figure \(\PageIndex{1}\): Progress from Discrete to Continuous Variables, Panel 1
Panel 2 shows how we begin to move from discrete values to continuous values. This occurs when we add more values of the independent variable, dependent variable, or both simultaneously. For example, instead of our independent variable being “Registered to Vote” as holding only two values, Yes or No, let’s think of this as “Likelihood of Being Registered to Vote” which holds more than two values. The likelihood ranges from higher, medium, and lower, and these values are represented by the increased number of rows.
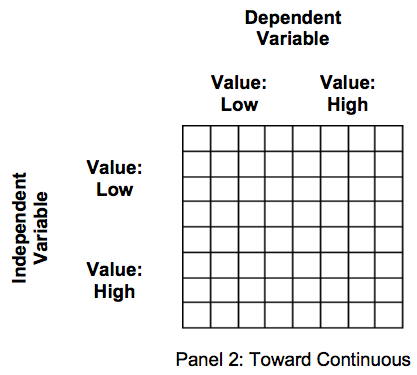
Figure \(\PageIndex{2}\): Progress from Discrete to Continuous Variables, Panel 2
Finally, panel 3 visually represents a continuous independent variable and dependent variable. The reason this is the case we have many values of both variables, as represented by the high number of rows and columns, in comparison to panel 2.
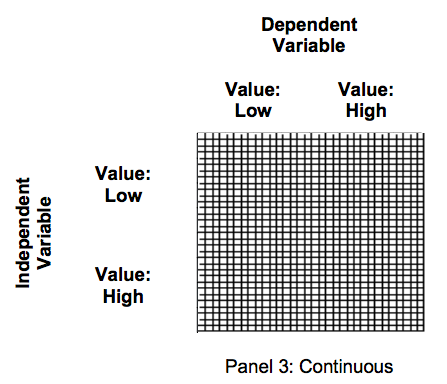
Figure \(\PageIndex{3}\): Progress from Discrete to Continuous Variables, Panel 3

