Learning Objectives
By the end of this section, you will be able to:
- Read and understand a standard regression table commonly found political science journals
- Comprehend the numerical expressions in a regression table, including the coefficient, standard error, and confidence level
Political scientists often present their analytical results of the research in the table. In addition, quite a few articles or books often will include summary statistics as well, usually prior to presenting their analysis. The previous sections equipped you with enough information to accurately review analyzes data published in various journals. However as mentioned throughout this book, methodological advancements are a feature in political science, particularly in the advancement of quantitative approaches. Researchers will often borrow techniques from other disciplines, especially those with tangential puzzles or problems, such as economics, or psychology. Likewise, they will seek to incorporate new developments from statisticians and/or from mathematicians in formal modeling or game theory.
Again, even though some researchers in political science use mathematical models of behavior or have begun using experimental methodology, quantitative research in political science relies heavily on observational methods. Once the information has been coded and arranged into a datasets, political scientists will often use a type of regression analysis. Even though this type of quantitative analysis is the most common approach, an in-depth discussion on regression and other statistical techniques is beyond the scope of this chapter and the textbook. However, we believe that it is nevertheless important to introduce you to a basic understanding of a statistical table in a journal article, and how analytical results of quantitative research are generally presented.
To repeat, a student needs additional exposure and training in quantitative methods in order to properly interpret a table of results generated by a regression statistical analysis. However, there are some elements of a regression table that warrants a discussion in this section as political science students will be required to read such tables in the articles they have been assigned in class. However, even before a student begins the analysis of a regression table, she first needs to identify the causal relationship being examined in the article. In other words, the first task in the analysis of a statistical results table is to identify the outcome (dependent) variable(s) and the explanatory (independent) variables. In the process of identification, one also needs to understand how each variable is quantified/measured (see Section 8.1). Also, it is important to identify the statistical model being estimated. Again, all this discussion is beyond the scope of the current chapter. We merely want to make you aware that there are many things to consider when looking at a regression table.
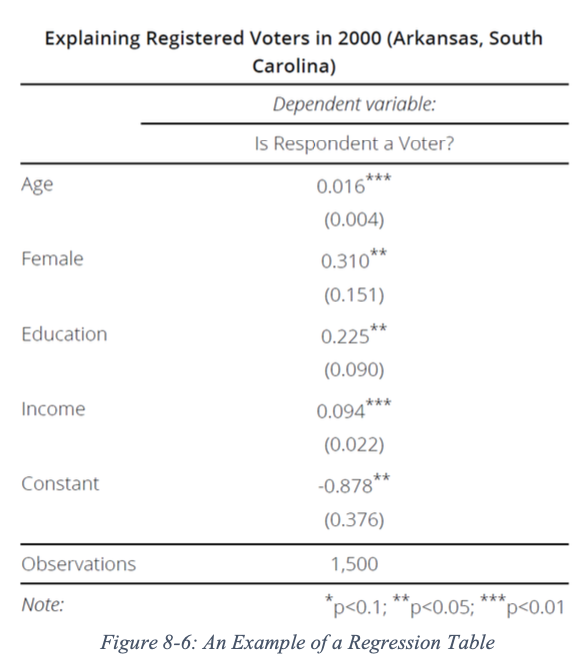
The first number to understand in the regression table above is called the coefficient. Coefficients inform the reader of the nature of the relationship between the outcome and explanatory variables. Each coefficient has either a positive or negative sign. A negative sign indicates an inverse relationship with the outcome variable. In simpler terms, if the value of a coefficient goes up, then the value of the outcome variable goes down. Conversely, a positive sign on a coefficient means that an increase in the value of the coefficient results in an increase in the value of outcome. In terms of substantive definition of a coefficient, or what does this relationship, either inverse or positive, really mean will depend on the statistical model utilized in the study.
The second number, right below the coefficient in parentheses is the standard error. In a very useful website by Steven Miller (“Reading a Regression Table: A Guide for Students” 2014), he notes that “the standard error is [an] estimate of the standard deviation of the coefficient”. This helps us in understanding just how correlated the two variables are. And it tells us how potentially wrong the estimate is as it captures how much uncertainty we have in the model. The higher the standard error, the weaker the model is relative to variables. This means that we are not as sure if the correlation, or relationship between the variables, is as certain as it may appear. Finally, researchers use the standard error when looking to improve the certainty of the findings.
The third set of numbers to consider are at the bottom of the regression table. These are the confidence levels for each coefficient. The idea of confidence is very similar to the concept of statistical significance or alpha levels introduced in Section 8.3. Typically speaking in the social sciences, researchers use asterisks (*) to report the level of significance. A coefficient with one asterisk “*” indicates that the relationship between the outcome and that particular variable has 90% confidence. In addition, two asterisks “**” indicates 95% and three asterisks signifies 99% confidence accordingly. Most statistical software programs, including Stata, R, SPSS, and SAS, automatically report the significance level of the explanatory variables. If the coefficients do not have any asterisk at all, that means that the model was unable to distinguish if the relationship between the outcome and the variables were important. Instead, it could be a result of random or systematic factors. In this case, researchers would report that these coefficients without any asterisks were statistically insignificant.
Finally, remember that in a regression table, there could be quite a few additional reported numerical indicators. In addition, the variety of statistical figures these will change depending on the utilized models. Furthermore, a researcher may include additional diagnostic tests, often to ensure the robustness of the model. As noted above, in order for a student to feel fully equipped to confidently be a “consumer” of quantitative political research, additional quantitative method and statistic courses will be required. However, we hope that in the very least this chapter has piqued your interest in quantitative approach to political research.

