The methods we have mentioned up to now examine the metabolic activity of the brain. But there are also other cases in which one wants to measure electrical activity of the brain or the magnetic fields produced by the electrical activity. The methods we discussed so far do a great job of identifying where activity is occurring in the brain. A disadvantage of these methods is that they do not measure brain activity on a millisecond-by-millisecond basis. This measuring can be done by electromagnetic recording methods, for example by single-cell recording or the Electroencephalography (EEG). These methods measure the brain activity really fast and over a longer period of time so that they can give a really good temporal resolution.
Single cell
When using the single-cell method an electrode is placed into a cell of the brain on which we want to focus our attention. Now, it is possible for the experimenter to record the electrical output of the cell that is contacted by the exposed electrode tip. That is useful for studying the underlying ion currents which are responsible for the cell’s resting potential. The researchers’ goal is then to determine for example, if the cell responds to sensory information from only specific details of the world or from many stimuli. So we could determine whether the cell is sensitive to input in only one sensory modality or is multimodal in sensitivity. One can also find out which properties of a stimulus make cells in those regions fire. Furthermore we can find out if the animal’s attention towards a certain stimulus influences in the cell’s respond.
Single cell studies are not very helpful for studying the human brain, since it is too invasive to be a common method. Hence, this method is most often used in animals. There are just a few cases in which the single-cell recording is also applied in humans. People with epilepsy sometimes get removed the epileptic tissue. A week before surgery electrodes are implanted into the brain or get placed on the surface of the brain during the surgery to better isolate the source of seizure activity. So using this method one can decrease the possibility that useful tissues will be removed. Due to the limitations of this method in humans there are other methods which measure electrical activity. Those we are going to discuss next.
EEG
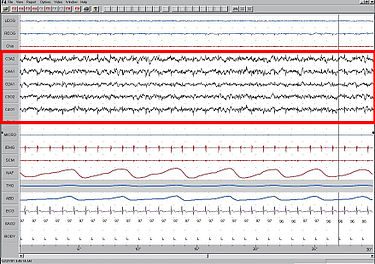
Placement of electrodesEEG record during sleep
One of the most famous techniques to study brain activity is probably the Electroencephalography (EEG). Most people might know it as a technique which is used clinically to detect aberrant activity such as epilepsy and disorders.
Electroencephalogram (Electroencephalography, EEG) is obtained by electro-electron electroencephalography, which collects weak creatures produced by the human brain from the scalp and enlarges notes. Measuring electroencephalogram, and EEG measures, voltage fluctuations generated by the flow of ionic neurons in the brain. EEG is a diagnosis of a brain-related disease, but because it is susceptible to interference, it is usually used in combination with other methods.
EEG is most commonly used to diagnose epilepsy because epilepsy can cause abnormal EEG readings. It is also used to diagnose sleep disorders, coma, cerebrovascular disease, etc., and brain death. Brain waves have been used in first-line methods to diagnose tumors, strokes, and other focal brain diseases, but this has been reduced with the advent of high-resolution anatomical imaging techniques, such as nuclear magnetic resonance (MRI). And computed tomography (CT). Unlike CT and MRI, EEGs have a higher temporal resolution. Therefore, although spatial resolution of EEG is limited, it is still a valuable tool for research and diagnostics, especially when determining studies that require time resolution in the millisecond range
Name
Frequency (Hz)
About
Delta(δ)
Theta(θ)
Alpha(α)
Beta(β)Low Range
Beta(β) Middle Range
Beta(β) High Range
Gamma(γ)
Lambda(λ)
P300
0.1~3 Hz
4~7Hz
8~12Hz
12.5 ~ 16 Hz
16.5 ~ 20 Hz
20.5 ~ 28 Hz
25 ~ 100 Hz(normally 40Hz)
according to the power generated
according to the power generated
Deep sleep and no dreams
When adults are under stress, especially disappointment or frustration
Relax, calm, close your eyes, but when you are awake
Relax but concentrate
Thinking, dealing with receiving external messages (hearing or thinking)
Induced by 100ms after the eye is stimulated by light (also known as P100)
Induced after seeing or hearing something imagined in the brain 300ms later
In an experimental way this technique is used to show the brain activity in certain psychological states, such as alertness or drowsiness. To measure the brain activity mental electrodes are placed on the scalp. Each electrode, also known as lead, makes a recording of its own. Next, a reference is needed which provides a baseline, to compare this value with each of the recording electrodes. This electrode must not cover muscles because its contractions are induced by electrical signals. Usually it is placed at the “mastoid bone” which is located behind the ear.
During the EEG electrodes are places like this. Over the right hemisphere electrodes are labelled with even numbers. Odd numbers are used for those on the left hemisphere. Those on the midline are labelled with a z. The capital letters stands for the location of the electrode(C=central, F=frontal, Fop= frontal pole, O= occipital, P= parietal and T= temporal).
After placing each electrode at the right position, the electrical potential can be measured. This electrical potential has a particular voltage and furthermore a particular frequency. Accordingly, to a person’s state the frequency and form of the EEG signal can differ. If a person is awake, beta activity can be recognized, which means that the frequency is relatively fast. Just before someone falls asleep one can observe alpha activity, which has a slower frequency. The slowest frequencies are called delta activity, which occur during sleep. Patients who suffer epilepsy show an increase of the amplitude of firing that can be observed on the EEG record. In addition EEG can also be used to help answering experimental questions. In the case of emotion for example, one can see that there is a greater alpha suppression over the right frontal areas than over the left ones, in the case of depression. One can conclude from this, that depression is accompanied by greater activation of right frontal regions than of left frontal regions.
The disadvantage of EEG is that the electric conductivity, and therefore the measured electrical potentials vary widely from person to person and, also during time. This is because all tissues (brain matter, blood, bones etc.) have other conductivities for electrical signals. That is why it is sometimes not clear from which exact brain-region the electrical signal comes from.
ERP
Whereas EEG recordings provide a continuous measure of brain activity, event-related potentials (ERPs) are recordings which are linked to the occurrence of an event. A presentation of a stimulus for example would be such an event. When a stimulus is presented, the electrodes, which are placed on a person’s scalp, record changes in the brain generated by the thousands of neurons under the electrodes. By measuring the brain's response to an event we can learn how different types of information are processed. Representing the word eats or bake for example causes a positive potential at about 200msec. From this one can conclude, that our brain processes these words 200 ms after presenting it. This positive potential is followed by a negative one at about 400ms. This one is also called N400 (whereas N stands for negative and 400 for the time). So in general one can say that there is a letter P or N to denote whether the deflection of the electrical signal is positive or negative. And a number, which represent, on average, how many hundreds of milliseconds after stimulus presentation the component appears. The event-related- potential shows special interest for researchers, because different components of the response indicate different aspects of cognitive processing. For example, presenting the sentences “The cats won’t eat” and “The cat won’t bake”, the N400 response for the word “eat” is smaller than for the word “bake”. From this one can draw the conclusion that our brain needs 400 ms to register information about a word’s meaning. Furthermore, one can figure out where this activity occurs in the brain, namely if one looks at the position on the scalp of the electrodes that pick up the largest response.
MEG
Magnetoencephalography (MEG) is related to electroencephalography (EEG). However, instead of recording electrical potentials on the scalp, it uses magnetic potentials near the scalp to index brain activity. To locate a dipole, the magnetic field can be used, because the dipole shows excellently the intensity of the magnetic field. By using devices called SQUIDs (superconducting quantum interference device) one can record these magnetic fields.
MEG is mainly used to localize the source of epileptic activity and to locate primary sensory cortices. This is helpful because by locating them they can be avoided during neurological intervention. Furthermore, MEG can be used to understand more about the neurophysiology underlying psychiatric disorders such as schizophrenia. In addition, MEG can also be used to examine a variety of cognitive processes, such as language, object recognition and spatial processing among others, in people who are neurologically intact.
MEG has some advantages over EEG. First, magnetic fields are less influenced than electrical currents by conduction through brain tissues, cerebral spinal fluid, the skull and scalp. Second, the strength of the magnetic field can tell us information about how deep within the brain the source is located. However, MEG also has some disadvantages. The magnetic field in the brain is about 100 million times smaller than that of the earth. Due to this, shielded rooms, made out of aluminum, are required. This makes MEG more expensive. Another disadvantage is that MEG cannot detect activity of cells with certain orientations within the brain. For example, magnetic fields created by cells with long axes radial to the surface will be invisible.