
3.13: Towards Strong Equivalence
- Page ID
- 35724

The Turing test has had a long, influential history (French, 2000). However, many would agree that it is flawed, perhaps because it is too easily passed. As a consequence, some have argued that artificial intelligence research is very limited (Weizenbaum, 1976). Others have argued for more stringent versions of the Turing test, such as the Total Turing Test.
Classical cognitive science recognizes that the Turing test provides a necessary, but not a sufficient, measure of a model’s validity. This is because it really only establishes weak equivalence, by collecting evidence that two systems are computationally equivalent. It accomplishes this by only examining the two devices at the level of the input-output relationship. This can only establish weak equivalence, because systems that use very different algorithms and architectures can still compute the same function.
Classical cognitive science has the goal of going beyond weak equivalence. It attempts to do so by establishing additional relationships between models and subjects, identities between both algorithms and architectures. This is an attempt to establish what is known as strong equivalence (Pylyshyn, 1984). Two systems are said to be strongly equivalent if they compute the same input-output function (i.e., 98 Chapter 3 if they are weakly equivalent), accomplish this with the same algorithm, and bring this algorithm to life with the same architecture. Cognitive scientists are in the business of making observations that establish the strong equivalence of their models to human thinkers.
Classical cognitive science collects these observations by measuring particular behaviours that are unintended consequences of information processing, and which can therefore reveal the nature of the algorithm that is being employed. Newell and Simon (1972) named these behaviours second-order effects; in Chapter 2 these behaviours were called artifacts, to distinguish them from the primary or intended responses of an information processor. In Chapter 2, I discussed three general classes of evidence related to artifactual behaviour: intermediate state evidence, relative complexity evidence, and error evidence.
Note that although similar in spirit, the use of these three different types of evidence to determine the relationship between the algorithms used by model and subject is not the same as something like the Total Turing Test. Classical cognitive science does not require physical correspondence between model and subject. However, algorithmic correspondences established by examining behavioural artifacts put much stronger constraints on theory validation than simply looking for stimulus-response correspondences. To illustrate this, let us consider some examples of how intermediate state evidence, relative complexity evidence, and error evidence can be used to validate models.
One important source of information that can be used to validate a model is intermediate state evidence (Pylyshyn, 1984). Intermediate state evidence involves determining the intermediate steps that a symbol manipulator takes to solve a problem, and then collecting evidence to determine whether a modelled subject goes through the same intermediate steps. Intermediate state evidence is notoriously difficult to collect, because human information processors are black boxes—we cannot directly observe internal cognitive processing. However, clever experimental paradigms can be developed to permit intermediate states to be inferred.
A famous example of evaluating a model using intermediate state evidence is found in some classic and pioneering research on human problem solving (Newell & Simon, 1972). Newell and Simon collected data from human subjects as they solved problems; their method of data collection is known as protocol analysis (Ericsson & Simon, 1984). In protocol analysis, subjects are trained to think out loud as they work. A recording of what is said by the subject becomes the primary data of interest.
The logic of collecting verbal protocols is that the thought processes involved in active problem solving are likely to be stored in a person’s short-term memory (STM), or working memory. Cognitive psychologists have established that items stored in such a memory are stored as an articulatory code that permits verbalization to maintain the items in memory (Baddeley, 1986, 1990; Conrad, 1964a, 1964b; Waugh & Norman, 1965). As a result, asking subjects to verbalize their thinking steps is presumed to provide accurate access to current cognitive processing, and to do so with minimal disruption. “Verbalization will not interfere with ongoing processes if the information stored in STM is encoded orally, so that an articulatory code can readily be activated” ” (Ericsson & Simon, 1984, p. 68).
In order to study problem solving, Newell and Simon (1972) collected verbal protocols for problems that were difficult enough to engage subjects and generate interesting behaviour, but simple enough to be solved. For instance, when a subject was asked to decode the cryptarithmetic problem DONALD + GERALD = ROBERT after being told that D = 5, they solved the problem in twenty minutes and produced a protocol that was 2,186 words in length.
The next step in the study was to create a problem behaviour graph from a subject’s protocol. A problem behaviour graph is a network of linked nodes. Each node represents a state of knowledge. For instance, in the cryptarithmetic problem such a state might be the observation that “R is odd.” A horizontal link from a node to a node on its right represents the application of an operation that changed the state of knowledge. An example operation might be “Find a column that contains a letter of interest and process that column.” A vertical link from a node to a node below represents backtracking. In many instances, a subject would reach a dead end in a line of thought and return to a previous state of knowledge in order to explore a different approach. The 2,186-word protocol produced a problem behaviour graph that consisted of 238 different nodes.
The initial node in a problem behaviour graph represents a subject’s starting state of knowledge when given a problem. A node near the end of the problem behaviour graph represents the state of knowledge when a solution has been achieved. All of the other nodes represent intermediate states of knowledge. Furthermore, in Newell and Simon’s (1972) research, these intermediate states represent very detailed elements of knowledge about the problem as it is being solved.
The goal of the simulation component of Newell and Simon’s (1972) research was to create a computer model that would generate its own problem behaviour graph. The model was intended to produce a very detailed mimicry of the subject’s behaviour—it was validated by examining the degree to which the simulation’s problem behaviour graph matched the graph created for the subject. The meticulous nature of such intermediate state evidence provided additional confidence for the use of verbal protocols as scientific data. “For the more information conveyed in their responses, the more difficult it becomes to construct a model that will produce precisely those responses adventitiously—hence the more confidence we can place in a model that does predict them” (Ericsson & Simon, 1984, p. 7).
Newell and Simon (1972) created a computer simulation by examining a subject’s problem behaviour graph, identifying the basic processes that it revealed in its links between nodes, and coding each of these processes as a production in a production system. Their model developed from the protocol for the DONALD + GERALD = ROBERT problem consisted of only 14 productions. The behaviour of this fairly small program was able to account for 75 to 80 percent of the human subject’s problem behaviour graph. “All of this analysis shows how a verbal thinkingaloud protocol can be used as the raw material for generating and testing a theory of problem solving behavior” (Newell & Simon, 1972, p. 227).
The contribution of Newell and Simon’s (1972) research to classical cognitive science is impossible to overstate. One of their central contributions was to demonstrate that human problem solving could be characterized as searching through a problem space. A problem space consists of a set of knowledge states—starting state, one or more goal states, and a potentially large number of intermediate states—that each represent current knowledge about a problem. A link between two knowledge states shows how the application of a single rule can transform the first state into the second. A problem behaviour graph is an example of a problem space. Searching the problem space involves finding a route—a sequence of operations—that will transform the initial state into a goal state. From this perspective, problem solving becomes the domain of control: finding as efficiently as possible an acceptable sequence of problem-solving operations. An enormous number of different search strategies exist (Knuth, 1997; Nilsson, 1980); establishing the strong equivalence of a problem-solving model requires collecting evidence (e.g., using protocol analysis) to ensure that the same search or control strategy is used by both model and agent.
A second kind of evidence that is used to investigate the validity of a model is relative complexity evidence (Pylyshyn, 1984). Relative complexity evidence generally involves examining the relative difficulty of problems, to see whether the problems that are hard (or easy) for a model are the same problems that are hard (or easy) for a modelled subject. The most common kind of relative complexity evidence collected by cognitive scientists is response latency (Luce, 1986; Posner, 1978). It is assumed that the time taken for a system to generate a response is an artifactual behaviour that can reveal properties of an underlying algorithm and be used to examine the algorithmic relationship between model and subject.
One domain in which measures of response latency have played an important role is the study of visual cognition (Kosslyn & Osherson, 1995; Pinker, 1985). Visual cognition involves solving information processing problems that involve spatial relationships or the spatial layout of information. It is a rich domain of study because it seems to involve qualitatively different kinds of information processing: the data-driven or preattentive detection of visual features (Marr, 1976; Richards, 1988; Treisman, 1985), top-down or high-level cognition to link combinations of visual features to semantic interpretations or labels (Jackendoff, 1983, 1987; Treisman, 1986, 1988), and processing involving visual attention or visual routines that include both data-driven and top-down characteristics, and which serve as an intermediary between feature detection and object recognition (Cooper & Shepard, 1973a, 1973b; Ullman, 1984; Wright, 1998).
Visual search tasks are frequently used to study visual cognition. In such a task, a subject is usually presented with a visual display consisting of a number of objects. In the odd-man-out version of this task, in one half of the trials one of the objects (the target) is different from all of the other objects (the distracters). In the other half of the trials, the only objects present are distracters. Subjects have to decide as quickly and accurately as possible whether a target is present in each display. The dependent measures in such tasks are search latency functions, which represent the time required to detect the presence or absence of a target as a function of the total number of display elements.
Pioneering work on visual search discovered the so-called pop-out effect: the time required to detect the presence of a target that is characterized by one of a small number of unique features (e.g., colour, orientation, contrast, motion) is largely independent of the number of distractor elements in a display, producing a search latency function that is essentially flat (Treisman & Gelade, 1980). This is because, regardless of the number of elements in the display, when the target is present it seems to pop out of the display, bringing itself immediately to attention. Notice how the target pops out of the display illustrated in Figure 3-11.
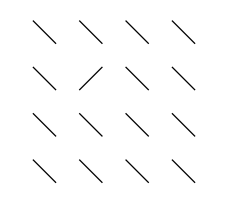
Figure 3-11. Unique features pop out of displays, regardless of display size.
In contrast, the time to detect a target defined by a unique combination of features generally increases with the number of distractor items, producing search latency functions with positive slopes. Figure 3-12 illustrates visual search in objects that are either connected or unconnected (Dawson & Thibodeau, 1998); connectedness 102 Chapter 3 is a property that is not local, but is only defined by relations between multiple features (Minsky & Papert, 1988). The larger the number of display items, the longer it takes to find the target when it is present in the display. Is there a target in Figure 3-12? If so, is it harder to find than the one that was present in Figure 3-11?
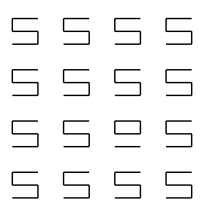
Figure 3-12. Unique combinations of features do not pop out.
Search latency results as those described above, which revealed that some objects pop out but others do not, formed the basis for feature integration theory (Treisman, 1985, 1986, 1988; Treisman & Gelade, 1980; Treisman & Gormican, 1988; Treisman, Sykes, & Gelade, 1977). Feature integration theory is a multistage account of visual cognition. In the first state, preattentive processors register the locations of a small set of primitive visual features on independent feature maps. These maps represent a small number of properties (e.g., orientation, colour, contrast movement) that also appear to be transduced by early neural visual detectors (Livingstone & Hubel, 1988). If such a feature is unique to a display, then it will be the only active location in its feature map. This permits pop out to occur, because the location of the unique, primitive feature is preattentively available.
Unique combinations of features do not produce unique activity in a single feature map and therefore cannot pop out. Instead, they require additional processing in order to be detected. First, attentional resources must be used to bring the various independent feature maps into register with respect to a master map of locations. This master map of locations will indicate what combinations of features coexist at each location in the map. Second, a “spotlight” of attention is used to scan the master map of locations in search of a unique object. Because this attentional spotlight can only process a portion of the master map at any given time, and because it must be scanned from location to location on the master map, it takes longer for unique combinations of features to be found. Furthermore, the search of the master map will become longer and longer as more of its locations are filled, explaining why the latency to detect unique feature combinations is affected by the number of distractors present.
Relative complexity evidence can also be used to explore some of the components of feature integration theory. For example, several researchers have proposed models of the how the attentional spotlight is shifted to detect targets in a visual search task (Fukushima, 1986; Gerrissen, 1991; Grossberg, 1980; Koch & Ullman, 1985; LaBerge, Carter, & Brown, 1992; Sandon, 1992). While the specific details of these models differ, their general structure is quite similar. First, these models represent the display being searched as an array of processors whose activities encode the visual distinctiveness of the location that each processor represents (i.e., how different it is in appearance relative to its neighbours). Second, these processors engage in a winner-take-all (WTA) competition (Feldman & Ballard, 1982) to identify the most distinctive location. This competition is defined by lateral inhibition: each processor uses its activity as an inhibitory signal in an attempt to reduce the activity of its neighbours. Third, the display element at the winning location is examined to see whether or not it is the target. If it is, the search stops. If it is not, activity at this location either decays or is inhibited (Klein, 1988), and a new WTA competition is used to find the next most distinctive location in the display.
This type of model provides a straightforward account of search latency functions obtained for targets defined by unique conjunctions of features. They also lead to a unique prediction: if inhibitory processes are responsible for directing the shift of the attentional spotlight, then search latency functions should be affected by the overall adapting luminance of the display. This is because there is a greater degree of inhibition during the processing of bright visual displays than there is for dimmer displays (Barlow, Fitzhugh, & Kuffler, 1957; Derrington & Lennie, 1982; Ransom-Hogg & Spillmann, 1980; Rohaly & Buchsbaum, 1989).
A visual search study was conducted to test this prediction (Dawson & Thibodeau, 1998). Modifying a paradigm used to study the effect of adaptive luminance on motion perception (Dawson & Di Lollo, 1990), Dawson and Thibodeau (1998) had subjects perform a visual search task while viewing the displays through neutral density filters that modified display luminance while not affecting the relative contrast of elements. There were two major findings that supported the kinds of models of attentional shift described above. First, when targets pop out, the response latency of subjects was not affected by adaptive luminance. This is consistent with feature integration theory, in the sense that a shifting attentional spotlight is not required for pop out to occur. Second, for targets that did not pop out, search latency functions were affected by the level of adaptive luminance. For darker displays, both the intercept and the slope of the search latency functions increased significantly. This is consistent with the hypothesis that this manipulation interferes with the inhibitory processes that guide shifts of attention.
A third approach to validating a model involves the use of error evidence. This approach assumes that errors are artifacts, in the sense that they are a natural consequence of an agent’s information processing, and that they are not a deliberate or intended product of this processing.
One source of artifactual errors is the way information processing can be constrained by limits on internal resources (memory or attention) or by external demands (the need for real time responses). These restrictions on processing produce bounded rationality (Simon, 1982). Another reason for artifactual errors lies in the restrictions imposed by the particular structure-process pairing employed by an information processor. “A tool too gains its power from the fact that it permits certain actions and not others. For example, a hammer has to be rigid. It can therefore not be used as a rope” (Weizenbaum, 1976, p. 37). Like a tool, a particular structure-process pairing may not be suited for some tasks and therefore produces errors when faced with them.
One example of the importance of error evidence is found in the large literature on human, animal, and robot navigation (Cheng, 2005; Cheng & Newcombe, 2005; Healy, 1998; Jonsson, 2002; Milford, 2008). How do organisms find their place in the world? One approach to answering this question is to set up small, manageable indoor environments. These “arenas” can provide a variety of cues to animals that learn to navigate within them. If an agent is reinforced for visiting a particular location, what cues does it use to return to this place?
One paradigm for addressing this question is the reorientation task invented by Ken Cheng (1986). In the reorientation task, an agent is typically placed within a rectangular arena. Reinforcement is typically provided at one of the corner locations in the arena. That is, the agent is free to explore the arena, and eventually finds a reward at a location of interest—it learns that this is the “goal location.” The agent is then removed from the arena, disoriented, and returned to an (often different) arena, with the task of using the available cues to relocate the goal. Of particular interest are experimental conditions in which the arena has been altered from the one in which the agent was originally trained.
An arena that is used in the reorientation task can provide two different kinds of navigational information: geometric cues and feature cues (Cheng & Newcombe, 2005). Geometric cues are relational, while feature cues are not.
A geometric property of a surface, line, or point is a property it possesses by virtue of its position relative to other surfaces, lines, and points within the same space. A non-geometric property is any property that cannot be described by relative position alone. (Gallistel, 1990, p. 212)
In a rectangular arena, metric properties (e.g., wall lengths, angles between walls) combined with an agent’s distinction between left and right (e.g., the long wall is to the left of the short wall) provide geometric cues. Non-geometric cues or feature cues can be added as well. For instance, one arena wall can have a different colour than the others (Cheng, 1986), or different coloured patterns can be placed at each corner of the arena (Kelly, Spetch, & Heth, 1998).
One question of interest concerns the relative contributions of these different cues for reorientation. This is studied by seeing how the agent reorients after it has been returned to an arena in which cues have been altered. For example, the feature cues might have been moved to new locations. This places feature cues in conflict with geometric cues. Will the agent move to a location defined by geometric information, or will it move to a different location indicated by feature information? Extensive use of the reorientation task has revealed some striking regularities.
Some of the most interesting regularities found in the reorientation task pertain to a particular error in reorientation. In an arena with no unique feature cues (no unique wall colour, no unique pattern at each corner), geometric cues are the only information available for reorienting. However, geometric cues cannot uniquely specify a goal location in a rectangular arena. This is because the geometric cues at the goal location (e.g., 90° angle, shorter wall to the left and longer wall to the right) are identical to the geometric cues present at the diagonally opposite corner (often called the rotational location). Under these conditions, the agent will produce rotational error (Cheng, 1986, 2005). When rotational error occurs, the trained agent goes to the goal location at above-chance levels; however, the animal goes to the rotational location equally often. Rotational error is usually taken as evidence that the agent is relying upon the geometric properties of the environment.
When feature cues are present in a rectangular arena, a goal location can be uniquely specified. In fact, when cues are present, an agent should not even need to pay attention to geometric cues, because these cues are not relevant. However, evidence suggests that geometric cues still influence behaviour even when such cues are not required to solve the task.
First, in some cases subjects continue to make some rotational errors even when feature cues specify the goal location (Cheng, 1986; Hermer & Spelke, 1994). Second, when feature cues present during training are removed from the arena in which reorientation occurs, subjects typically revert to generating rotational error (Kelly, Spetch, and Heth, 1998; Sovrano, Bisazza, & Vallortigara, 2003). Third, in studies in which local features are moved to new locations in the new arena, there is a conflict between geometric and feature cues. In this case, reorientation appears to be affected by both types of cues. The animals will not only increase their tendency to visit the corner marked by the feature cues that previously signaled the goal, but also produce rotational error for two other locations in the arena (Brown, Spetch, & Hurd, 2007; Kelly, Spetch, and Heth, 1998).
Rotational error is an important phenomenon in the reorientation literature, and it is affected by a complex interaction between geometric and feature cues. A growing variety of models of reorientation are appearing in the literature, including models consistent with the symbol-manipulating fundamental of classical cognitive science (Cheng, 1986; Gallistel, 1990), neural network models that are part of connectionist cognitive science (Dawson et al., 2010), and behaviour-based robots that are the domain of embodied cognitive science (Dawson, Dupuis, & Wilson, 2010; Nolfi, 2002). All of these models have two things in common. First, they can produce rotational error and many of its nuances. Second, this error is produced as a natural byproduct of a reorientation algorithm; the errors produced by the models are used in aid of their validation.