Reliability is the degree to which the measure of a construct is consistent or dependable. In other words, if we use this scale to measure the same construct multiple times, do we get pretty much the same result every time, assuming the underlying phenomenon is not changing? An example of an unreliable measurement is people guessing your weight. Quite likely, people will guess differently, the different measures will be inconsistent, and therefore, the “guessing” technique of measurement is unreliable. A more reliable measurement may be to use a weight scale, where you are likely to get the same value every time you step on the scale, unless your weight has actually changed between measurements.
Note that reliability implies consistency but not accuracy. In the previous example of the weight scale, if the weight scale is calibrated incorrectly (say, to shave off ten pounds from your true weight, just to make you feel better!), it will not measure your true weight and is therefore not a valid measure. Nevertheless, the miscalibrated weight scale will still give you the same weight every time (which is ten pounds less than your true weight), and hence the scale is reliable.
What are the sources of unreliable observations in social science measurements? One of the primary sources is the observer’s (or researcher’s) subjectivity. If employee morale in a firm is measured by watching whether the employees smile at each other, whether they make jokes, and so forth, then different observers may infer different measures of morale if they are watching the employees on a very busy day (when they have no time to joke or chat) or a light day (when they are more jovial or chatty). Two observers may also infer different levels of morale on the same day, depending on what they view as a joke and what is not. “Observation” is a qualitative measurement technique. Sometimes, reliability may be improved by using quantitative measures, for instance, by counting the number of grievances filed over one month as a measure of (the inverse of) morale. Of course, grievances may or may not be a valid measure of morale, but it is less subject to human subjectivity, and therefore more reliable. A second source of unreliable observation is asking imprecise or ambiguous questions. For instance, if you ask people what their salary is, different respondents may interpret this question differently as monthly salary, annual salary, or per hour wage, and hence, the resulting observations will likely be highly divergent and unreliable. A third source of unreliability is asking questions about issues that respondents are not very familiar about or care about, such as asking an American college graduate whether he/she is satisfied with Canada’s relationship with Slovenia, or asking a Chief Executive Officer to rate the effectiveness of his company’s technology strategy – something that he has likely delegated to a technology executive.
So how can you create reliable measures? If your measurement involves soliciting information from others, as is the case with much of social science research, then you can start by replacing data collection techniques that depends more on researcher subjectivity (such as observations) with those that are less dependent on subjectivity (such as questionnaire), by asking only those questions that respondents may know the answer to or issues that they care about, by avoiding ambiguous items in your measures (e.g., by clearly stating whether you are looking for annual salary), and by simplifying the wording in your indicators so that they not misinterpreted by some respondents (e.g., by avoiding difficult words whose meanings they may not know). These strategies can improve the reliability of our measures, even though they will not necessarily make the measurements completely reliable. Measurement instruments must still be tested for reliability. There are many ways of estimating reliability, which are discussed next.
Inter-rater reliability. Inter-rater reliability, also called inter-observer reliability, is a measure of consistency between two or more independent raters (observers) of the same construct. Usually, this is assessed in a pilot study, and can be done in two ways, depending on the level of measurement of the construct. If the measure is categorical, a set of all categories is defined, raters check off which category each observation falls in, and the percentage of agreement between the raters is an estimate of inter-rater reliability. For instance, if there are two raters rating 100 observations into one of three possible categories, and their ratings match for 75% of the observations, then inter-rater reliability is 0.75. If the measure is interval or ratio scaled (e.g., classroom activity is being measured once every 5 minutes by two raters on 1 to 7 response scale), then a simple correlation between measures from the two raters can also serve as an estimate of inter-rater reliability.
Test-retest reliability. Test-retest reliability is a measure of consistency between two measurements (tests) of the same construct administered to the same sample at two different points in time. If the observations have not changed substantially between the two tests, then the measure is reliable. The correlation in observations between the two tests is an estimate of test-retest reliability. Note here that the time interval between the two tests is critical. Generally, the longer is the time gap, the greater is the chance that the two observations may change during this time (due to random error), and the lower will be the test-retest reliability.
Split-half reliability. Split-half reliability is a measure of consistency between two halves of a construct measure. For instance, if you have a ten-item measure of a given construct, randomly split those ten items into two sets of five (unequal halves are allowed if the total number of items is odd), and administer the entire instrument to a sample of respondents. Then, calculate the total score for each half for each respondent, and the correlation between the total scores in each half is a measure of split-half reliability. The longer is the instrument, the more likely it is that the two halves of the measure will be similar (since random errors are minimized as more items are added), and hence, this technique tends to systematically overestimate the reliability of longer instruments.
Internal consistency reliability. Internal consistency reliability is a measure of consistency between different items of the same construct. If a multiple-item construct measure is administered to respondents, the extent to which respondents rate those items in a similar manner is a reflection of internal consistency. This reliability can be estimated in terms of average inter-item correlation, average item-to-total correlation, or more commonly, Cronbach’s alpha. As an example, if you have a scale with six items, you will have fifteen different item pairings, and fifteen correlations between these six items. Average inter-item correlation is the average of these fifteen correlations. To calculate average item-to-total correlation, you have to first create a “total” item by adding the values of all six items, compute the correlations between this total item and each of the six individual items, and finally, average the six correlations. Neither of the two above measures takes into account the number of items in the measure (six items in this example). Cronbach’s alpha, a reliability measure designed by Lee Cronbach in 1951, factors in scale size in reliability estimation, calculated using the following formula:
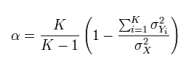
where K is the number of items in the measure,  is the variance (square of standard deviation) of the observed total scores, and
  is the observed variance for item i. The standardized Cronbach’s alpha can be computed using a simpler formula:
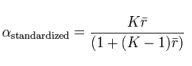
where K is the number of items,  is the average inter-item correlation, i.e., the mean of K(K1)/2 coefficients in the upper triangular (or lower triangular) correlation matrix.

