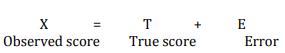
Now that we know the different kinds of reliability and validity, let us try to synthesize our understanding of reliability and validity in a mathematical manner using classical test theory, also called true score theory. This is a psychometric theory that examines how measurement works, what it measures, and what it does not measure. This theory postulates that every observation has a true score T that can be observed accurately if there were no errors in measurement. However, the presence of measurement errors E results in a deviation of the observed score X from the true score as follows:
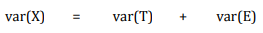
Across a set of observed scores, the variance of observed and true scores can be related using a similar equation:
The goal of psychometric analysis is to estimate and minimize if possible the error variance var(E), so that the observed score X is a good measure of the true score T.
Measurement errors can be of two types: random error and systematic error. Random error is the error that can be attributed to a set of unknown and uncontrollable external factors that randomly influence some observations but not others. As an example, during the time of measurement, some respondents may be in a nicer mood than others, which may influence how they respond to the measurement items. For instance, respondents in a nicer mood may respond more positively to constructs like self-esteem, satisfaction, and happiness than those who are in a poor mood. However, it is not possible to anticipate which subject is in what type of mood or control for the effect of mood in research studies. Likewise, at an organizational level, if we are measuring firm performance, regulatory or environmental changes may affect the performance of some firms in an observed sample but not others. Hence, random error is considered to be “noise” in measurement and generally ignored.
Systematic error is an error that is introduced by factors that systematically affect all observations of a construct across an entire sample in a systematic manner. In our previous example of firm performance, since the recent financial crisis impacted the performance of financial firms disproportionately more than any other type of firms such as manufacturing or service firms, if our sample consisted only of financial firms, we may expect a systematic reduction in performance of all firms in our sample due to the financial crisis. Unlike random error, which may be positive negative, or zero, across observation in a sample, systematic errors tends to be consistently positive or negative across the entire sample. Hence, systematic error is sometimes considered to be “bias” in measurement and should be corrected.
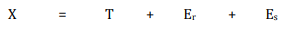
Since an observed score may include both random and systematic errors, our true score equation can be modified as:
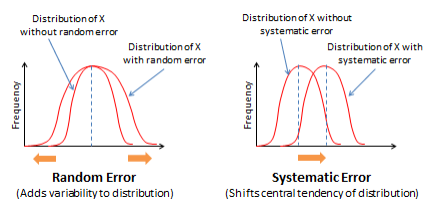
Figure 7.3.Figure 7.3. Effects of random and systematic errors
What does random and systematic error imply for measurement procedures? By increasing variability in observations, random error reduces the reliability of measurement. In contrast, by shifting the central tendency measure, systematic error reduces the validity of measurement. Validity concerns are far more serious problems in measurement than reliability concerns, because an invalid measure is probably measuring a different construct than what we intended, and hence validity problems cast serious doubts on findings derived from statistical analysis.
Note that reliability is a ratio or a fraction that captures how close the true score is relative to the observed score. Hence, reliability can be expressed as:
If var(T) = var(X), then the true score has the same variability as the observed score, and the reliability is 1.0.