To begin our study of contemporary families in the United States, we will first define an important concept that is used for a large portion of this book: social constructions. A social construction is a mutual understanding and accepted reality created by members of a society: something that is not determined by biology or the natural world. Is there anything that humans have created that holds no real value in the natural world, yet we have assigned a great deal of value to it? If you are thinking of cash, you’re right on the money. Humans have determined that certain pieces of paper and metal objects are worth an agreed-upon value. For example, in the United States, a one dollar bill is worth 100 times the value of a penny. One of the ways that we can tell money is a social construction is that it varies from culture to culture and over time. When you visit another country, the United States dollar bill has to be “exchanged” for money that has a different appearance and value. Compare money with another thing of value to human beings: air. Air is needed by all human beings to survive. The need for air and its value do not change over time or from culture to culture.
Figure 1.2. Breakfast burrito.
Social constructions also relate to behavior and activities. For example, what food would you expect to see on the menu when you go out for breakfast in the United States? What if the eating place were described as a “Mexican” restaurant? And what if you traveled to another country, say, Korea? What is eaten for breakfast varies from culture to culture and even person to person. And yet, in general, we have a socially constructed idea of what is typically breakfast food in the United States: eggs, bacon, cereal, toast, and fruit, but not vegetables, noodles, pinto beans, or hot dogs. One of the ways that you can recognize that something is a socially constructed idea is that it differs from place to place and changes over time. In addition, whatever is part of the socially constructed idea (in this case what typical breakfast foods are) becomes “the norm” or what is expected. While we might welcome trying some different foods for breakfast, they are not what is seen as the typical, or expected, American breakfast foods.
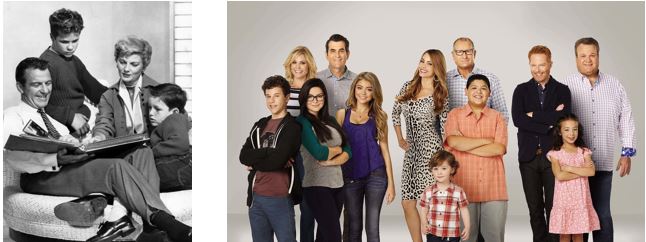
What does this have to do with families? While studying families, we must continually remind ourselves that the idea of the family, and in particular the internalized belief that there is a “normal family,” is a social construction. What is a normal family? I suspect that we can each paint a picture in our heads, based on the years each of us has been exposed to portrayals of families in institutions such as the media, schools, government, and health care. Generally, the traditional American family has been identified as the nuclear family, most often represented as a male and female heterosexual married couple who is middle class, White, and with several children. When society or the individuals within a society designate one kind of family to be traditional, this may imply a value, or a preference, for this kind of family structure with these particular social characteristics. This is sometimes called the “Leave it to Beaver” family after the popular sitcom television show that ran from 1957 until 1963, pictured below left. A current popular sitcom, Modern Family, which just concluded its 11th season in 2020, also features this traditional family, but includes two other families which feature people of other ethnic groups, and a same-sex couple. Together they form an extended family who all live in the same town. It is important to note, however, that the primacy of the upper middle-class, White family image continues to be emphasized.
Figure 1.3. TV families in the 1950s vs. today.
As we study families we must keep in mind that this idea of the typical family is not representative of all families, yet it is continually reinforced by the social processes and institutions in our society. Media in particular continually reminds us of what families are “supposed to” look like. Whether you consume big-budget films, social media platforms, video games, and/or books and magazines, take a look. What kind of people and families do you see represented? While representation of women, people of color, and people of differing sexualities and gender expressions has increased in media, they still predominantly play less consequential characters within the plot lines. Although the majority of families in the United States no longer fit the traditional model,[1]social institutions perpetuate the idea of a certain family structure. Government, schools, medical institutions, businesses, and places of worship all reinforce a typical view of family through the forms, activities, requirements, and processes that are shared with the public. How many times have you tried to fill out a form with checkboxes only to find that you did not “fit” into one of the boxes? Typical examples include giving parental choices of “mother” and “father,” couple status choices such as “married” or “single,” and gender choices such as “male” or female,” all of which reinforce a binary view of individuals and families.
The preference for an idealized traditional family type contributes to less social support for families who don’t fit this type: for example, single-parent families, LGBTQ+ families, rural families, or families with a member who is disabled, unemployed, or who has a criminal record. Accepted structures and practices such as not being able to access a safe neighborhood or good school because of income, “Daddy-Daughter Dances,” churches that exclude or condemn LGBTQ+ ministers and/or members, and educational materials that cannot be read with low vision are all examples of ways that some individuals and families are less recognized and less privileged. You can probably think of other examples from your own family’s perspective. Families exist in multiple forms that are functional.
The social construction of difference describes value being assigned to a perceived difference[2] (in this case, the form and function of families). While Allan Johnson wrote about differences in privilege related to social characteristics such as race, ethnicity, gender, and ability, we will extend this concept to the social construction of differences amongst families. Via the socially constructed idea of family, American systems and structures regularly create and reinforce inequities amongst American families.
Equity, Equality, and Fairness
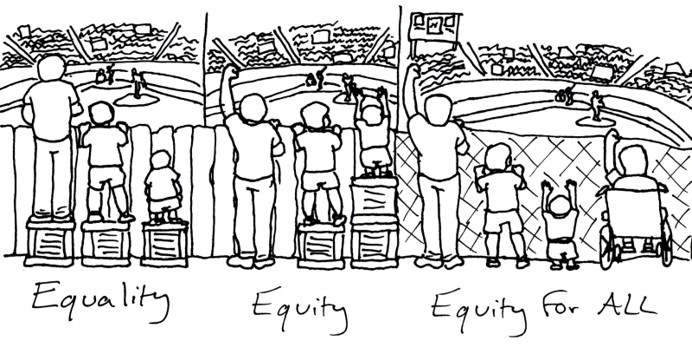
You will notice that this text often refers to equity rather than equality or fairness. It’s important that equity is defined, and this drawing by one of the text’s authors illustrates the difference (you may have seen different variations of this concept as memes on social media). If you’d like to read more about it, this blog has a good explanation.
Figure 1.4. Equality, Equity, Equity for all.
This text asserts that all families need access to equitable resources, and analyzes the experiences and structures that get in the way. In the first panel of the drawing, although all of the participants have equal-sized boxes, they do not all get to have an equal experience. In the second drawing, the participants can have the viewing experience because the boxes have been equitably distributed. And in the third panel, the structure that limited equitable access has been removed so that all participants can view the game without additional resources.
In this text, we will study American families with an emphasis on the current inequities in the United States. To help us understand the socially constructed nature of our view of the family and the systems that affect families, we will take a comparative approach.[3] This means that, while our focus is current American families, we will also look at how families have evolved in America, what the practices are of immigrant cultures in America, and how other countries develop systems that affect families. We will also utilize empirical research, data that are collected in a variety of ways, analyzed, and presented to further our understanding.
21st Century American Families
While we are studying families, it is important to note the concept of kinship. While definitions vary, it is widely agreed that the term kinship is broader than the term family. Kinship refers to the social structure that ties people together (whether by blood, marriage, legal processes, or other agreements) and includes family relationships. Kinship acknowledges that individuals have a role in defining who is a member of their own family and how familial relationships extend across society.
What are families in the United States like today? Because we are constrained by both our personal experiences, as well as the societal representations of “typical families,” it is important to talk about what kinds of kinship structures and changes are actually occurring. At times, the study of families has been referred to as the study of “the family.” This text avoids that terminology because we are studying many types of families.
In order to describe current American families and kinship structures, it is probably easiest to compare them with families of the past and families in other countries. Here is a snapshot of some kinship patterns:
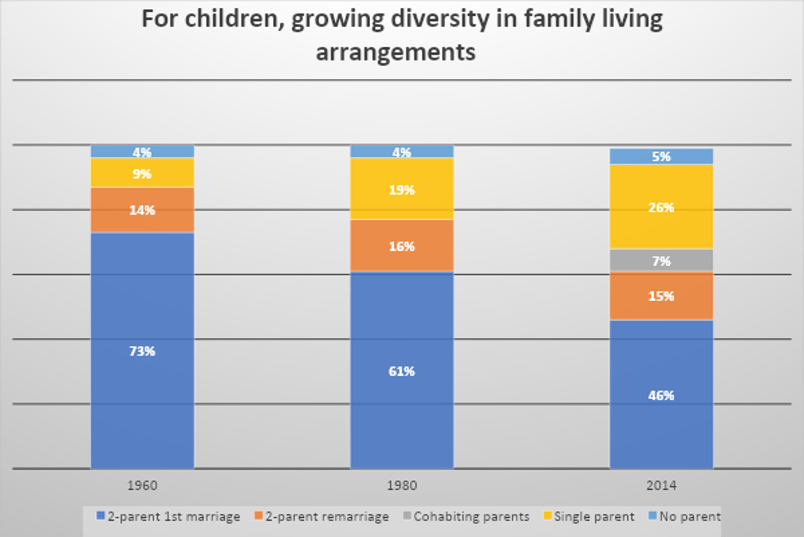
There is no longer one dominant family form in the United States; children are living in increasingly varied family arrangements.
In this chart, based on data from the Pew Research Center, increases are noted in children living with a single parent (yellow color) and cohabiting parents (gray color).
Data for cohabitation was not available in 1960 and 1980; those children were included in the group “single parents.”
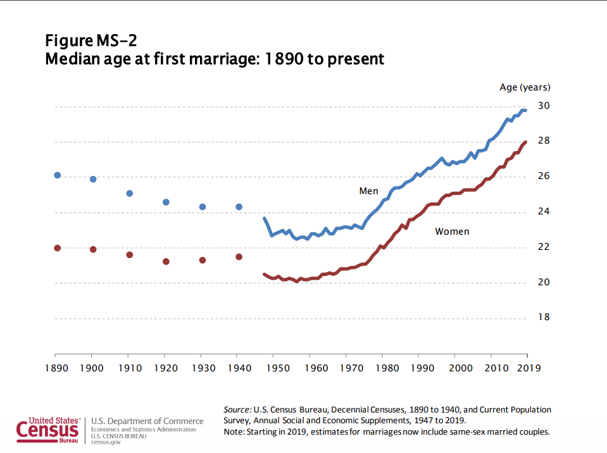
Americans are getting married later in life.
This graph shows the increase, for both men (blue) and women (red) in the median age of first marriage:
Figure 1.6. A Census graph showing first marriage age going up since the 1950s.
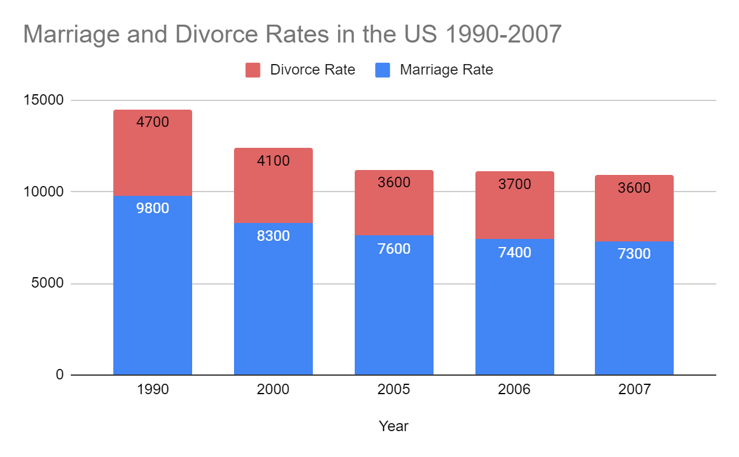
Both marriage and divorce rates are declining in the United States.
The marriage rate (blue) is declining a bit faster than the divorce rate (red), which is one of the factors that makes it appear as if divorce is increasing. It’s actually declining, just at a slower rate than marriage is declining:
Figure 1.7. Marriage and divorce rates have gone down since the 1990s. This data comes from Statistical Abstract, 2009 based on the U.S. Census.
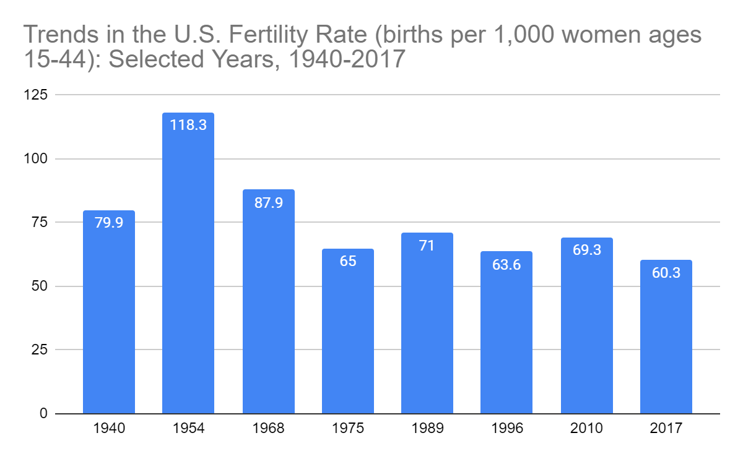
Fertility rates are declining in the U.S.
Women are having fewer children, following the “Baby Boom” years between approximately 1946 and 1964.
Figure 1.8. Fertility rates in the US have gone down since peaking in 1954.
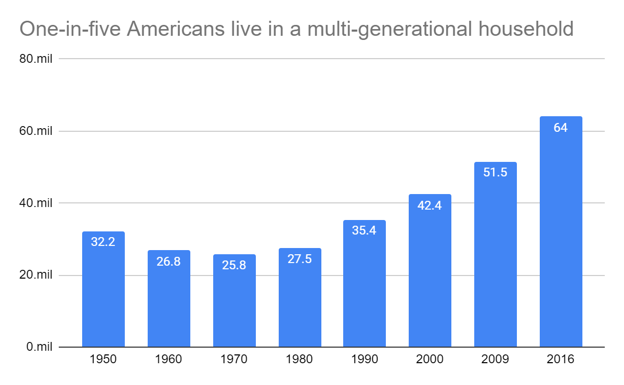
Families are increasingly living in multigenerational households.
Multigenerational living includes families with two or more adult generations and families that have grandchildren under the age of twenty-five and grandparents living together. This style of living hit a low of 12% of all families in the U.S. in 1980. Since then, multigenerational living has increased in most racial and ethnic groups, age groups, and genders.[4]
Figure 1.9. The number of Americans who live in multigenerational households has increased since the low in the 1980s. This graph is based on an analysis by the Pew Research Center based on data from the US Census and 2000-2016 American Community Survey.
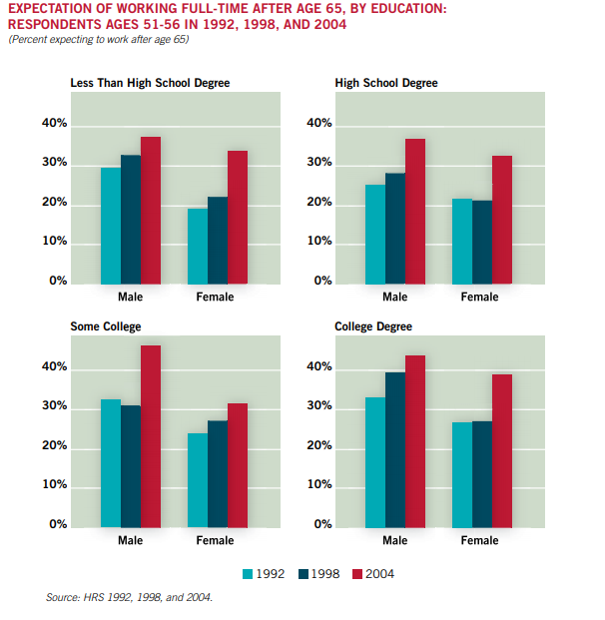
Most expect to work until an older age now than did workers in the 20th century.
Beneficial trends such as longer life expectancy and being healthier longer affect people’s decisions to work longer. Less beneficial trends such as concern about having adequate health care coverage, fewer jobs that have pensions associated with them, and the increasing number of workers who have multiple part-time jobs also affect this trend.
Figure 1.10. People are expecting to work longer.
This graph shows differentiation by gender and by education level, but there is also differentiation related to wealth, income, and kind of employment. Look at the difference between 1992 (light blue) and 2004 (red). Notice that for both genders, and with all education levels, people are expecting to work longer!
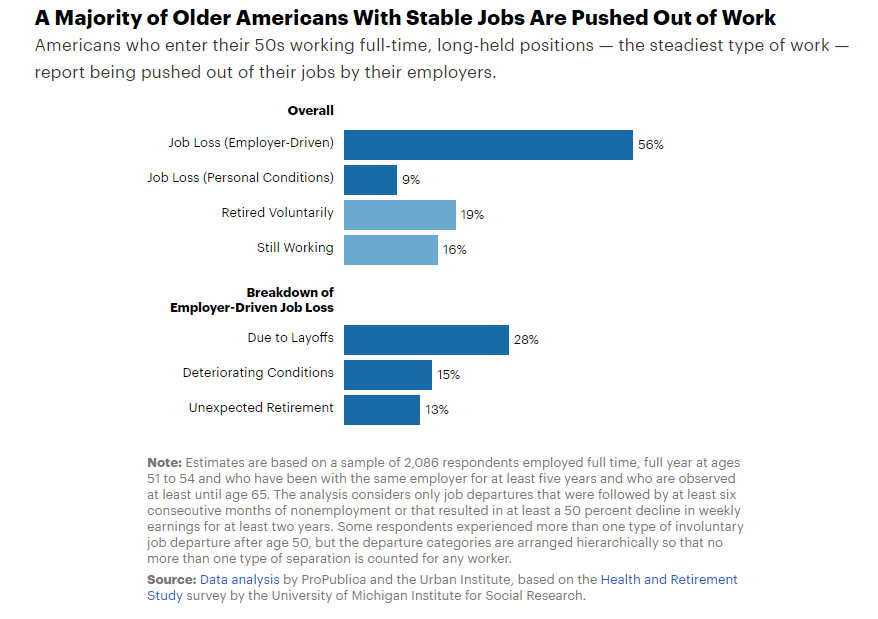
But expectations do not always match experience, and there is sufficient evidence that older workers are consistently forced out of stable, well-paying jobs at a significant percentage.
Figure 1.11. Most Americans don’t retire because they want to.
Families have both private and public functions. Notably, American society today is more concerned with the private function of families, which focuses on the intimate relationships that family members share with one another. Americans value the idea that a core part of the family function is the indefinite length of loving relationships.[5]
In the past, and today in other cultures and countries, families were more focused on the public function such as the production of what would be called public goods in an economic model. The most common public good in American families are children, but caring for elderly or differently-abled adults could also be considered as producing a public good. Volunteering and contributing to places of worship, charitable organizations, and other not-for-profit agencies is another way to perform the public function. As public institutions, families support, contribute to, and benefit from the overall social structure. Although our society currently focuses on the private function, families implicitly perform both; these functions are complementary to one another. In this text we will raise awareness of the public function.
The focus on the private function of families may relate to the United States’ identity as an individualistic society.[6] In America, there is a focus on what individuals can achieve, with value placed on accomplishments that are gained without the support of society. Many other countries have collectivist[7] cultures which emphasize social support for all, so that all members of the group are able to meet their goals and needs.
Adaptations: juxtaposed with “Modern Family” photo.
Figure 1.6. “Median age at first marriage: 1890-present” by the US Census. Public domain.
Figure 1.10. “Expectation of working full time after age 65” is from the Health and Retirement Study by the National Institute on Aging. Public domain.
Figure 1.4. “Equality, Equity, Equity for All” by Katie Niemeyer. License: CC BY 4.0. Based on ideas originally illustrated by Angus Maguire and Craig Froehle.