The United States of America is inhabited by many diverse people, including distinguishable generations of society's members based on age. Gerontology is the scientific study of the processes and phenomena of aging and growing old. The definition of being elderly varies. For example, the government typically sets 65 to be the elderly years, the American Association of Retired Persons finds 55 to be the eligible age of membership, and many elderly define their 70's or 80's as the time they begin to feel elderly. Gerontology is multi-disciplinary with medical and biological scientists, social scientists, and even financial and economic scientists all studying the processes of aging from their discipline's point of view.
Social Gerontology is the sociological sub field of gerontology which focuses on the nonphysical and social aspects of aging. Sociology focuses on the broad understanding of the elderly experience, their health, their emotional and social wellness, and their quality of life, just to mention a few. How many elderly lived in the US in 2008?
Table 1: Numbers and Percent of United States Population Aged 65 and Over 2008*
US Elderly
15-64 Years old
≤ 14 years of Age
United States Total
38,690,169
203,987,724
61,146,753
303,824,646
12.7%
67.1%
20.1%
100%
*Estimates retrieved 17 June 2008 from www.cia.gov/library/publicat.../print/us.html
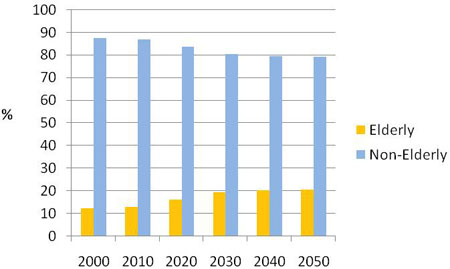
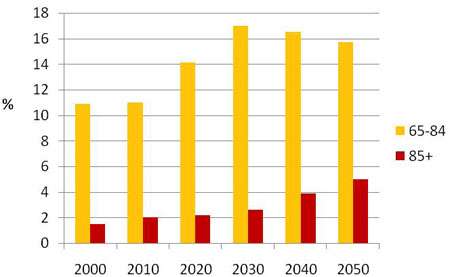
The future growth of the US elderly population is immense in comparison to previous Census tabulations and growth rates. In Figure 1 below you see tremendous growth in the United States where the elderly now comprise only 1 in 8 members of US society, but in 2050 will comprise 1 in 5. In Figure 2 below you can see that the oldest old, 85 years and older, is also growing rapidly. This means that in general more people are living longer. In fact there are more centenarians than ever before. A Centenarian is a living person who has had their 100 birthday. US Census counts indicated about 37,000 centenarians in 1990 and about 50,000 in 2000 (See Kestenbaum and Reneé, 2006 Retrieved from the Internet 19 July, 2008 from http://findarticles.com/p/articles/m...7/ai_n17183322 ).
In many societies the elderly are revered (especially Asian societies). Filial Pietyis the value, respect, and reverence of one's elderly which is often accompanied by care giving and support of the elderly. In Western countries, the elderly and their extended family are considered co-equals and mutually independent until circumstances necessitate assistance from children and other family members.
Figure 1: Estimated percentage of US population that will be Elderly and Non-Elderly, 2000-2050*. *Estimates retrieved 18 June 2008 from www.census.gov/ipc/www/usinte...projtab02a.pdf Table 2a. Projected Population of the United States, by Age and Sex, 2000 to 2050.Figure 2: Estimated percentage of US population that will be 65-84 and over 85, 2000-2050*. *Estimates retrieved 18 June 2008 from www.census.gov/ipc/www/usinte...projtab02a.pdf Table 2a. Projected Population of the United States, by Age and Sex, 2000 to 2050.
Understanding the Generations of Life
A Life Courseis an ideal sequence of events and positions the average person is expected to experience as he/she matures and moves through life. Dependence and independence levels change over the life course. In Figure 3 below, you can see that from birth to teen years, that children's levels of dependence are relatively high and our levels of independence are relatively low. Newborns have little ability to nurture others, but as they are socialized and grow into their later-teen roles things change. By young adulthood, independence is a prime value which leads many to move out on their own and gain their own experiences (like most of you did). A young adult's ability to nurture is moderate, but often dormant since most pursue avenues of preparation for their adult lives rather than immediately beginning their own families. Married and cohabiting couples are much more independent and capable of nurturing and remain so throughout the grand-parenting years. As the life course progresses into later life, the oldest elderly begin to lose their independence as their health declines to the point that their resources lag behind the daily demands placed upon them. This is because all of us experience senescence. Senescence is the social, emotional, biological, intellectual, and spiritual processes associated with aging.
Table 2: Diagram of Dependence and Independence Over the Life Course.
Stage
Dependence or Independence Level
Own Ability to Nuture
Birth to Pre-school
Totally Dependent
Low
Pre-School
Mostly Dependent
Low
School to Pre-teen
Somewhat Dependent
Low
Teen to Young Adult
Increasingly Dependent
Moderate
Young Adult
Moderately Independent
Moderate
Young Married
Mostly Independent
Somewhat High
Young Parents
Almost Independent
High
Parents
Independent
High
Grandparents
Extremely Independent
High
Great Grandparents
Somewhat Independent
Moderate
For many in our modern societies, aging is feared, vilified, and surgically and cosmetically repaired. We do not like being “off our game” and senescence is viewed as a weakness. Yet, many elderly find their lives very satisfying. And they tend to report higher levels of self-esteem than do younger members of society. Because we tend to value youth, youthful appearance, and youthful-centered entertainment, biases appear in the US. There are, in the United States, many who hold deeply held biases and prejudices against the elderly. Ageism is the prejudice and discrimination against a person based on his/her chronological age.
Ageism is a unique form of bias. One may be prejudiced against another racial group, cultural or ethnic group, or religious group while never being at risk of becoming a member of that group. Ironically, ageist people are aging right now and will be until the day they die; they are essentially biased against their own future status.
For those who seek understanding of the elderly, there are three social theories that might help to understand the elderly and their later-life experiences. These are listed in order of their professional value by Gerontologists who study aging-related psychosocial issues.
The Continuity Theoryclaims that older adults maintain patterns in their later years which they had in their younger years. The elderly adapt to the many changes which accompany aging using a variety of effective personal strategies they developed earlier in their life. For example, those who participated in outdoor activities in their younger years tend to continue to do so as older adults, although they tend to accommodate their health and fitness limitations as they deem appropriate.
The Activity Theoryclaims that the elderly benefit from high levels of activities, especially meaningful activities that help to replace lost life roles after retirement. The key to success in later-life is staying active and, by doing so, resist the social pressures that limit an older person's world. (Google Robert Havighurst and Aging).
The Disengagement Theoryclaims that as elderly people realize the inevitability of death and begin to systematically disengage from their previous youthful roles, society simultaneously prepares the pre-elderly and elderly to disengage from their roles. This was the first formal aging theory that fell short of credibility because the scientific data did not support its assumptions. There is quite a bit of support for Continuity and Activity Theories (see The Encyclopedia of Aging).
To really understand the elderly today you have to understand the larger social changes that have transpired over the last century. Around 1900, US elderly held a more cherished place in the hearts of younger family members. Most homes were intergenerational with grandparents, parents, and children all living in the same home and more often with kin on the wife's side being the social connection around which 3 generations would live (see Dorian Apple Sweetser, 1984 “Love and Work: Intergenerational Household Composition in the U. S. in 1900” Journal of Marriage and the Family, Vol. 46, No. 2 (May, 1984), pp. 289-293 retrieved on 18 June 2008 from www.jstor.org/stable/352460?seq=1 ).
In 2000, the US Census Bureau reported that there were 105.5 million households in the country (report C2KBR/01-8 retrieved on 18 June 2008). Table 2 reports that 3.7 percent or nearly 4 million households are multigenerational. Not having older relatives live in your home probably feels normal, however, the point is that in years past elderly family members were considered a valuable asset with their wisdom and support of their children and grandchildren.
Theorizing Later Life
The Modernization Theoryclaims that industrialization and modernization have lowered the power and influence which the elderly once had and that this has lead to much exclusion of elderly from community roles. Even though this theory is not as well established and is somewhat controversial, it has made a place in science for understanding how large-scale social forces have impacted the individual and collective lives of the elderly. In our modern societies: the economy has grown to a state that has created new levels of prosperity for most; the new technologies have outpaced the ability of the elderly to understand and use them; and the elderly are living much longer and are not essential to the economic survival of the family as was the case for millennia. Modernization can help us to understand why the elderly have become stigmatized and devalued over the last century.
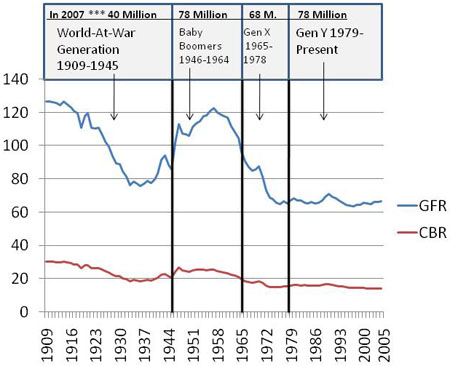
Who make up the generations of our day? Look at Figure 4 below to see birth rates and generation labels for the United States. First notice the red and blue lines. The red represents the Crude Birth Rate. Crude Birth Rateis a measure of the numbers of births per 1,000 population in a given year. The Blue line represents the General Fertility Rate. General Fertility Rate is a measure of the numbers of live births per 1,000 women aged 15-44. Both CBR and GBRs show a pattern of birth rates that were relatively high when the World-At-War Generation was born. Birth rates declined with the Great Depression until 1946 (the commencement of the Baby Boom). The Baby Boom represented a surge in birth rates that endured from 1946-1964 and declined to pre-Boom rates in 1965. Generation X or “Gen X” represents the children of the Baby Boomers which spilled into Generation Y or the “Millennials” which by most accounts are still being born.
Figure 4: jkhzsdgjkhzsdffgkjhskjflgh. *Retrieved 19 June, 2008 from Table 77: Live Births, Deaths, Marriages, and Divorces 1960-2006 www.census.gov/compendia/stat...es/08s0077.pdf and Table 1: Live births, birth rates, and Fertility Rates by Race: United States Specified Years, 1940-1955 and Each year 1960-2005
The World-At-War Generation is slowly disappearing from the US population landscape. On the 18th of June, 2008 the last living Veteran of World War I was honored by the White House and Congress. Frank W. Buckles fought in WWI and was held prisoner in Manila during World War II (see CNN, retrieved on 19 June, 2008 from http://www.cnn.com/2008/US/03/07/war.veteran/ ). Also the US Veterans Bureau reported that there were 2,911,900 WWII veterans as of the 30th of September 2007, with about 900 WWII veterans passing away each day. They also reported that 39.1 percent of all US veterans were aged 65 and older (See data sheet retrieved 19 June 2008 from www1.va.gov/vetdata/docs/4X6_...sharepoint.pdf ).
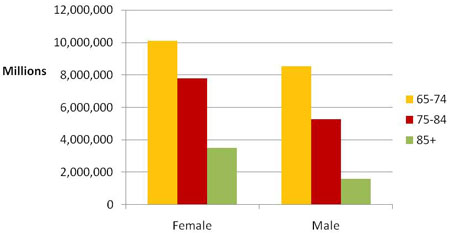
The majority of the elderly today are women. If you consider the elderly as being divided into three life stages you can discern just how the elderly are comprised comparing males to females. The Young-old=65-74 years; the Middle-old=75-84 years; and the Old-old= 85+ years. In 2005 there were more females in all three ages: 65-74; 75-84; and 85+. This is because women, in most countries of the world, have a higher life expectancy than men. Life Expectancyis the average numbers of years a person born today may expect to live. The US Life expectancy today is about 80 for females and 75 for males (worldwide it 70 for females and 66 for males; see www.prb.org, 2007 Population Data Sheet , retrieved 19 June 2008). Life expectancies have increased dramatically over the last 50 years in the Western nations of Canada, United States, Australia, Japan, and Western Europe. Overall, men and women can expect to live longer than they did in the 1940s-1990s.
Figure 5: Numbers of US Elderly Population Ages 65-74, 75-84, and 85+*. *Data retrieved 19 June 2008 from Table 1: Resident population, by age, sex, race, and Hispanic origin: United States, selected years 1950–2005 from http://www.cdc.gov/nchs/data/hus/hus07.pdf#001
Sex Ratio is the number of males per 100 females. The sex ratio in the quote above which was 44 for persons 58 to 89 would be interpreted as 44 males per 100 females. I found this quote from www.census.gov about US elderly males and females:
“Perhaps no feature of the oldest old is as striking as their sex ratio (the number of males per 100 females), which was 39 in 1994 (982,000 males and 2.5 million females). The sex ratio in the United States was 44 for persons 85 to 89 years old, and only 26 for persons 95 to 99 years old. In comparison, the sex ratio was 82 for persons 65 to 69 years old." (retrieved 19 June 2008 from www.census.gov).
The Baby Boomers represent 78.2 million US citizens as of the 1st of July, 2005 (see www.census.gov). This large cohort of society's member is moving on mass into the ranks of the elderly. A Cohortis a group of people who share a statistical or demographic trait such as those born between 1946-1964. Nearly 8,000 Baby Boomers turned 60 each day in 2006. The US Census estimates that 57.8 million baby Boomers will be around in 2030 after they've all retired. One issue for gerontologist is the financial strain the Baby Boomers will place on the rest of society once they are retired. Most speculate that baby Boomers will not receive the same from the Social Security Administration benefits that their parents and grandparents enjoyed.
The children of the Baby Boomers were called the Generation X children or the “Baby Bust” because they were born in post-Boom low fertility rate years. They were different from their parents. They grew up with the computer age and came to computer technology much like an immigrant comes to a new country. This cohort grew up in an economic state of greater posterity than did previous generations. Generation Y, or Millennials, are also called the “Internet Generation or Screenagers” because they grew up with TV, video games, cell phones, PDAs, and movie screens. Each generation is culturally distinct compared to the previous ones even though much still remains in common. There is a good chance that children of Generation Y parents will be better skilled than their parents with a technology that has not yet been invented. Such has been the case comparing the last three generations.
In Tables 3 & 4 you see the increasing life expectancies in the US. The elderly of the future will be expected to live longer than any elderly in the history of the United States and world. Being born in the US affords the average member of society a longer life. In Table 3 below you can see that North American children are born with the higher life expectancies than other children around the world. By far, being born in Japan and Hong Kong would provide the absolute highest life expectancy at birth at 82 years for the total.
Table 2: United States Life Expectancies. (Retrieved 19 June 2008 Table 98: Expectations of Life at Birth, 1970-2004, and Projections, 2010 and 2015; www.census.gov/compendia/stat...es/08s0098.pdf ).
Year
Total
Male
Female
1970
70.8
67.1
74.7
1980
73.7
70.0
77.4
1990
75.4
71.8
78.8
2000
77.0
74.3
79.7
2010
78.5
75.6
81.4
2015
79.2
76.2
82.2
Table 4: 2007 World and Regional Life Expectancies. *(www.prb.org, 2007 Population Data Sheet , retrieved 19 June 2008)
Region
Total
Male
Female
World
68
66
70
Africa
53
52
54
N. America
78
70
81
L. America
73
70
76
Asia
68
67
70
Europe
75
71
79
Oceania
75
73
78
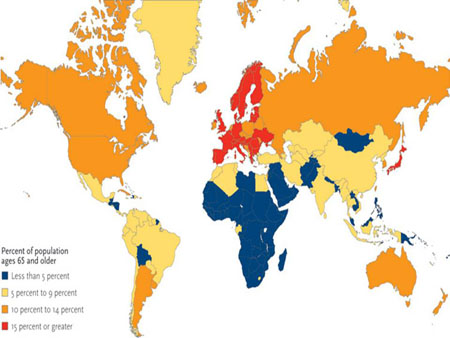
In fact all regions of the world are growing older. The developing countries are aging the fastest. Consider this screen capture and color map taken from the Population Reference Bureau World Population data Sheet 2007, Page 6:
Figure 6: Population Aging Is Occurring Worldwide. (Retrieved 19 June 2008 from WWW.PRB.org Population Data Sheet 2007: Sources: C. Haub, 2007 World Population Data Sheet, and United Nations Population Division).
Population Aging Is Occurring Worldwide.
Over the past half-century, both the worldwide drop in fertility and the concurrent rise in life expectancy have led to the gradual aging of the world's population. Look at Table 4 below. Since 1950, the share of persons ages 65 and older has risen from 5 percent to 7 percent worldwide. As the map shows, Europe and Japan have led the way, with North America, Australia, and New Zealand close behind. However, older persons are now more than 5 percent of the inhabitants in many developing countries and by 2050 are expected to be 19 percent of Latin America's population and 18 percent of Asia's.
Table 5: Worldwide Percent of Persons Ages 65 and Older
2025
2050
WORLD
7
10
16
Industrialized Countries
16
21
26
Developing Countries
6
9
15
Europe
16
21
28
North America
12
18
21
Oceania
10
15
19
Latin Am. & Caribbean
6
10
9
Asia
6
10
18
Africa
3
4
7
(Retrieved 19 June 2008 from WWW.PRB.org Population Data Sheet 2007: Sources: C. Haub, 2007 World Population Data Sheet, and United Nations Population Division).
As mentioned, elderly women outlive elderly men.
Widowhood occurs when one's spouse dies
Widows are surviving wives
Widowers are surviving husbands
As a young college student you probably don't worry about ever being a widow or widower. Justifiably, you shouldn't have to based on statistical probabilities. In fact, you are more likely to lose a spouse via death than via divorce. Do some math with me. If you are female and marry a guy 2 years older, and he typically dies 5-6 years before you, then you will be a widow at some time in your life and may live 6-8 years as such. One sub-discipline of gerontology is thanatology. Thanatologyis the scientific study of death and dying. Thanatology informs those who provide support and counsel to the dying.
How we define death, both our own and the death of others, is very much influenced by the cultural definition of death we incorporated into our own values while growing up. Most of us are related to someone who died in the last 24 months. It's very common for college students about your age to have lost a great aunt/uncle, great grandparent, and even a grand parent. It's not so common for you to have lost you own parent or sibling. Grief is the feeling of loss we experience after a death, disappointment, or tragedy. When you experience grief you are said to be in bereavement. Bereavement is a name for the circumstances and conditions that accompany grief.
Dr. Elisabeth Kübler-Ross published her work as the stages of grief. These include:
denial - “All is fine, or it didn't happen”
anger - “why me? Or I hate God for this”
bargaining - "I'd be a better person if you (God) will just let him live”
depression - “all is lost, or why try?”
acceptance - "we'll be okay or we can get through this together”
(see “On Death and Dying," 1973; Routledge Press).
I've noticed that we all grieve when things disappoint us, when someone dies, or even when we break up with someone. I've seen my seniors grieve to a certain degree when they did not get into graduate school on their first try. We all grieve and we all grieve in our own way. Studies show that most people experience denial, anger, bargaining, depression, or acceptance, but there exists some disagreement on the part about cycling through Kübler-Ross' stages in any order.
The study of aging, the study of generations, the study of life course, and the study of death and dying are part of the social gerontology approach. Courses and degrees are offered throughout the US and abroad and there are many professions where gerontologist work throughout their careers.