The goal of most intelligence tests is to measure “g”, the general intelligence factor. Good intelligence tests are reliable, meaning that they are consistent over time, and also demonstrate validity, meaning that they actually measure intelligence rather than something else. Because intelligence is such an important individual difference dimension, psychologists have invested substantial effort in creating and improving measures of intelligence, and these tests are now considered the most accurate of all psychological tests. In fact, the ability to accurately assess intelligence is one of the most important contributions of psychology to everyday public life.
Intelligence changes with age. A 3-year-old who could accurately multiply 183 by 39 would certainly be intelligent, but a 25-year-old who could not do so would be seen as unintelligent. Thus understanding intelligence requires that we know the norms or standards in a given population of people at a given age. The standardization of a test involves giving it to a large number of people at different ages and computing the average score on the test at each age level.
It is important that intelligence tests be standardized on a regular basis, because the overall level of intelligence in a population may change over time. The Flynn effect refers to the observation that scores on intelligence tests worldwide have increased substantially over the past decades (Flynn, 1999). Although the increase varies somewhat from country to country, the average increase is about 3 IQ points every 10 years. There are many explanations for the Flynn effect, including better nutrition, increased access to information, and more familiarity with multiple-choice tests (Neisser, 1998). But whether people are actually getting smarter is debatable (Neisser,1997).
Once the standardization has been accomplished, we have a picture of the average abilities of people at different ages and can calculate a person’s mental age, which is the age at which a person is performing intellectually. If we compare the mental age of a person to the person’s chronological age, the result is the Intelligence Quotient (IQ), a measure of intelligence that is adjusted for age. A simple way to calculate IQ is by using the following formula:
Thus a 10-year-old child who does as well as the average 10-year-old child has an IQ of 100 (10 ÷ 10 × 100), whereas an 8-year-old child who does as well as the average 10-year-old child would have an IQ of 125 (10 ÷ 8 × 100). Most modern intelligence tests are based on the relative position of a person’s score among people of the same age, rather than on the basis of this formula, but the idea of an intelligence “ratio” or “quotient” provides a good description of the score’s meaning.
Wechsler Scales
A number of scales are based on the IQ. The Wechsler Adult lntelligence Scale (WAIS) is the most widely used intelligence test for adults (Watkins, Campbell, Nieberding, & Hallmark, 1995). The current version of the WAIS, the WAIS-IV, was standardized on 2,200 people ranging from 16 to 90 years of age. It consists of 15 different tasks, each designed to assess intelligence, including working memory, arithmetic ability, spatial ability, and general knowledge about the world. The WAIS-IV yields scores on four domains: verbal, perceptual, working memory, and processing speed. The reliability of the test is high (more than 0.95), and it shows substantial construct validity. The WAIS-IV is correlated highly with other IQ tests such as the Stanford-Binet, as well as with criteria of academic and life success, including college grades, measures of work performance, and occupational level. It also shows significant correlations with measures of everyday functioning among people with intellectual disabilities.
The Wechsler scale has also been adapted for preschool children in the form of the Wechsler Primary and Preschool Scale of Intelligence-Fourth Edition (WPPSI-IV) and for older children and adolescents in the form of the Wechsler Intelligence Scale for Children-Fifth Edition (WISC-V). Figure 5.12 illustrates items from the WAIS.
Figure 5.12 Sample Items from the Wechsler Adult Intelligence Scale (WAIS). Source.
Bias: Intelligence tests and psychological definitions of intelligence have been heavily criticized since the 1970s for being biased in favor of Anglo-American, middle-class respondents and for being inadequate tools for measuring non-academic types of intelligence or talent. Intelligence changes with experience, and intelligence quotients or scores do not reflect that ability to change. What is considered smart varies culturally as well, and most intelligence tests do not take this variation into account. For example, in the West, being smart is associated with being quick. A person who answers a question the fastest is seen as the smartest, but in some cultures being smart is associated with considering an idea thoroughly before giving an answer. A well-thought out, contemplative answer is the best answer.
Extremes of Intelligence: Intellectual Disability and Giftedness
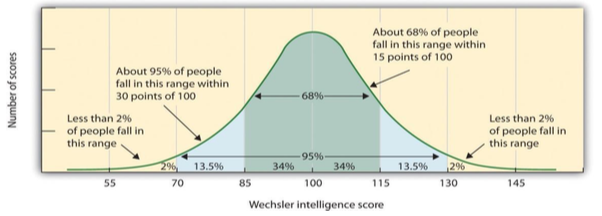
The results of studies assessing the measurement of intelligence show that IQ is distributed in the population in the form of a Normal Distribution (or bell curve), which is the pattern of scores usually observed in a variable that clusters around its average. In a normal distribution, the bulk of the scores fall toward the middle, with many fewer scores falling at the extremes. The normal distribution of intelligence shows that on IQ tests, as well as on most other measures, the majority of people cluster around the average (in this case, where IQ = 100), and fewer are either very smart or very dull (see Figure 5.13). Because the standard deviation of an IQ test is about 15, this means that about 2% of people score above an IQ of 130, often considered the threshold for giftedness, and about the same percentage score below an IQ of 70, often being considered the threshold for an intellectual disability.
Although Figure 5.13 presents a single distribution, the actual IQ distribution varies by sex such that the distribution for men is more spread out than is the distribution for women. These sex differences mean that about 20% more men than women fall in the extreme (very smart or very dull) ends of the distribution (Johnson, Carothers, & Deary, 2009). Boys are about five times more likely to be diagnosed with the reading disability dyslexia than are girls (Halpern, 1992), and are also more likely to be classified as having an intellectual disability. However, boys are also about 20% more highly represented in the upper end of the IQ distribution.
Figure 5.13: Distribution of IQ scores in the general population. The normal distribution of IQ scores in the general population shows that most people have about average intelligence, while very few have extremely high or extremely low intelligence.
One end of the distribution of intelligence scores is defined by people with very low IQ. Intellectual disability (or intellectual developmental disorder) is assessed based on cognitive capacity (IQ) and adaptive functioning. The severity of the disability is based on adaptive functioning, or how well the person handles everyday life tasks. About 1% of the United States population, most of them males, fulfill the criteria for intellectual developmental disorder, but some children who are given this diagnosis lose the classification as they get older and better learn to function in society. A particular vulnerability of people with low IQ is that they may be taken advantage of by others, and this is an important aspect of the definition of intellectual developmental disorder (Greenspan, Loughlin, & Black, 2001).
One cause of intellectual developmental disorder is Down syndrome, a chromosomal disorder caused by the presence of all or part of an extra 21st chromosome. The incidence of Down syndrome is estimated at approximately 1 per 700 births, and the prevalence increases as the mother’s age increases (CDC, 2014a). People with Down syndrome typically exhibit a distinctive pattern of physical features, including a flat nose, upwardly slanted eyes, a protruding tongue, and a short neck (see Figure 5.14).
Fortunately, societal attitudes toward individuals with intellectual disabilities have changed over the past decades.Wenolongeruseterms such as “retarded,” “moron,” “idiot,” or “imbecile” to describe people with intellectual deficits, although these were the official psychological terms used to describe degrees of what was referred to as mental retardation in the past. Laws such as the Americans with Disabilities Act (ADA) have made it illegal to discriminate on the basis of mental and physical disability, and there has been a trend to bring people with mental disabilities out of institutions and into our workplaces and schools.
Giftedness refers to children who have an IQ of 130 or higher (Lally & Valentine-French, 2015). Having extremely high IQ is clearly less of a problem than having extremely low IQ, but there may also be challenges to being particularly smart. It is often assumed that schoolchildren who are labeled as “gifted” may have adjustment problems that make it more difficult for them to create social relationships. To study gifted children, Lewis Terman and his colleagues (Terman & Oden, 1959) selected about 1,500 high school students who scored in the top 1% on the Stanford-Binet and similar IQ tests (i.e., who had IQs of about 135 or higher), and tracked them for more than seven decades (the children became known as the “termites” and are still being studied today). This study found that these students were not unhealthy or poorly adjusted, but rather were above average in physical health and were taller and heavier than individuals in the general population. The students also had above average social relationships and were less likely to divorce than the average person (Seagoe, 1975).
Terman’s study also found that many of these students went on to achieve high levels of education and entered prestigious professions, including medicine, law, and science. Of the sample, 7% earned doctoral degrees, 4% earned medical degrees, and 6% earned law degrees. These numbers are all considerably higher than what would have been expected from a more general population. Another study of young adolescents who had even higher IQs found that these students ended up attending graduate school at a rate more than 50 times higher than that in the general population (Lubinski & Benbow, 2006).
As you might expect based on our discussion of intelligence, kids who are gifted have higher scores on general intelligence “g”, but there are also different types of giftedness. Some children are particularly good at math or science, some at automobile repair or carpentry, some at music or art, some at sports or leadership, and so on. There is a lively debate among scholars about