Like many groups discussed in this module, Asian Americans represent a great diversity of cultures and backgrounds. The experience of a Japanese American whose family has been in the United States for three generations will be drastically different from a Laotian American who has only been in the United States for a few years.
How and Why They Came
The national and ethnic diversity of Asian American immigration history is reflected in the variety of their experiences in joining U.S. society. Asian immigrants have come to the United States primarily in the third wave (1880-1914) and fourth wave (1965-present), but also in the second wave (1820-1860). The 1965 Immigration and Nationality Act removed national-origin quotas established in 1921, resulting in marked population growth during this period with 491,000 Asian immigrants in 1960 and 12.8 million Asian immigrants in 2014, which accounts from a 2,597% increase. As of 2014, the top five origin countries of Asian immigrants were India, China, the Philippines, Vietnam, and Korea.
The first Asian immigrants to come to the United States in the mid-nineteenth century were Chinese. These immigrants were primarily men whose intention was to work for several years in order to earn incomes to send back to their families in China. Their main destination was the American West, where the Gold Rush (’49 ers) was drawing people with its lure of abundant money. The construction of the Transcontinental Railroad was underway at this time, and the Central Pacific section hired thousands of migrant Chinese men to complete the laying of rails across the rugged Sierra Nevada mountain range. Chinese men also engaged in other manual labor like mining and agricultural work. This work was grueling and underpaid, but like many immigrants, they persevered.
Japanese immigration began in the 1880s, on the heels of the Chinese Exclusion Act of 1882. Many Japanese immigrants came to Hawaii to work in the sugar industry; others came to the mainland, especially to California. Unlike the Chinese, however, the Japanese had a strong government in their country of origin that negotiated with the U.S. government to ensure the well-being of their immigrants. Japanese men were able to bring their wives and families to the United States, and were thus able to produce second- and third-generation Japanese Americans more quickly than their Chinese counterparts.
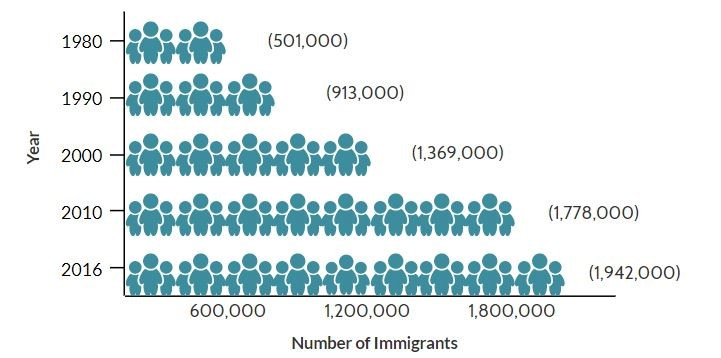
Figure \(\PageIndex{1}\): Filipino Immigrant Population in the United States, 1980-2016. (Data from U.S. Census Bureau 2010 and 2016 American Community Surveys (ACS), and Campbell J. Gibson and Kay Jung, “Historical Census Statistics on the Foreign-born Population of the United States: 1850-2000” (Working Paper no. 81, U.S. Census Bureau, Washington, DC, February 2006) (CC BY 4.0; via Lumens)
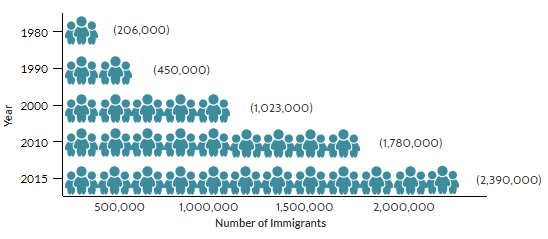
Fourth wave Asian immigration included immigrants from India, Korea, Vietnam, and the Philippines. As you can see in Figure 9.1.2, Indian immigration grew between 1980 and 2010 more than eleven-fold, roughly doubling every decade. It is composed primarily of English-speaking, highly educated immigrants, many of whom qualified for an H-1B (a temporary visa for highly skilled immigrants). In 2013, India and China supplanted Mexico as the top sources of newly arriving immigrants in the United States.
Figure \(\PageIndex{2}\): Indian Immigrant Population in the United States, 1980-2015. (Data from U.S. Census Bureau 2010 and 2015 American Community Surveys (ACS), and 1980, 1990, and 2000 Decennial Census, www.migrationpolicy.org/arti...-united-states) (CC BY 4.0; via Lumens)
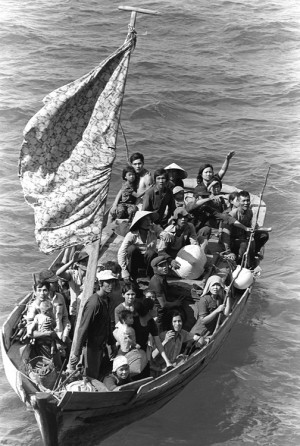
Wars in Korea and Vietnam led to increased immigration from those countries after 1965. While Korean immigration has been fairly gradual, Vietnamese immigration was more concentrated after 1975, when the formerly U.S.-backed city of Saigon fell and a restrictive communist government was established. Whereas many Asian immigrants came to the United States to seek better economic opportunities, Vietnamese immigrants came as political refugees, seeking asylum from repressive conditions in their homeland. The Refugee Act of 1980 helped them settle in the United States, with large numbers coming from Vietnam, Laos, and Cambodia. Many of these refugees settled in California, Minnesota, and Wisconsin, forming ethnic enclaves in urban areas (ethnic enclaves defined in Chapter 1.3).
Figure \(\PageIndex{3}\): Thirty-five Vietnamese refugees wait to be taken aboard the amphibious USS Blue Ridge (LCC-19). They are being rescued from a thirty-five-foot fishing boat 350 miles northeast of Cam Ranh Bay, Vietnam, after spending eight days at sea. (CC PDM 1.0; PH2 Phil Eggman (U.S. Navy) via Wikimedia) (CC BY 4.0; via Lumens)
Current Status
Asian Americans are a rapidly growing part of the population. The New York University (NYU) Center for the Study of Asian American Health examines growth in New York City. Researchers there found that New York City (NYC) is home to nearly 1.2 million documented and undocumented Asian Americans, representing more than 13% of the total NYC population. This diverse population (more than 20 countries of origin and 45 languages and dialects) grew by 110% from 1990 to 2010.
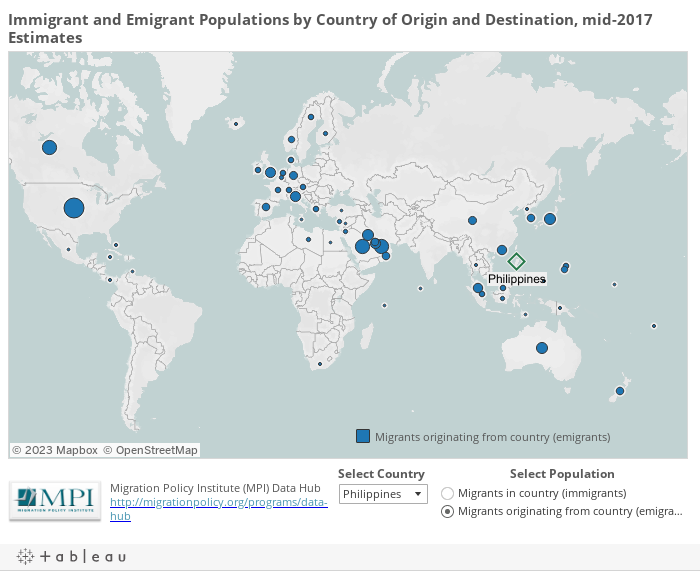
Immigrant and Emigrant Populations by Country of Origin and Destination
Click below on the Interactive map on immigrant and emigrant populations to examine where many of the world’s 258 million international migrants moved. You can use the dropdown menu to select a country of origin to see where emigrants have settled.
Figure \(\PageIndex{4}\): Immigrant and Emigrant Populations by Country of Origin and Destination. (CC BY 4.0; via Lumens)
Model Minority Myth
Asian Americans certainly have been subject to their share of racial prejudice, despite the seemingly positive stereotype as the model minority. The model minority stereotype is applied to a group that is seen as achieving significant educational, professional, and socioeconomic success without challenging the existing establishment. This stereotype is typically applied to Asian groups in the United States, and it can result in unrealistic expectations by putting a stigma on those who do not meet the presumed standard. Stereotyping all Asians as smart and capable can also limit much-needed government assistance, and can result in educational and professional discrimination.
According to the NYC Opportunity tabulations, 17.9% of people living in poverty in New York City were Asian Americans, and they had the highest poverty rate of any racial or ethnic group at 29%. Contradictorily, Asian American community organizations received only 1.4% of the city’s social service contract dollars from the Department of Social Services.
Crazy Rich Asians
The trailer from the blockbuster hit Crazy Rich Asians (2018) is but one example, portrayal of Asian American immigrants. Then consider the questions that follow.
Why do you think there is such a disconnect between numbers of Asian Americans in poverty and funding for Asian community organizations?
What would be the unique challenges of obtaining survey data in Asian communities that might not pose the same challenges in other minority communities? How would you suggest addressing these sampling challenges?
In what ways is the model minorityan ideology to justify inequality and racism?
Do you think dark-skinned Asian Americans might be subjected to more prejudice and discrimination than light-skinned Asian Americans?
Ethnic Communities & Enclaves
Immigration is a major component in the lives of many Asian Americans -- why they come, how many, and what happens to them after they arrive. Since the establishment of the first Asian American communities in the U.S., Asian American "enclaves" have become a significant part of virtually every major city in America. As more Asians immigrate to the U.S., traditional communities not only grow but also evolve as they absorb the new arrivals and adapt to the non-Asian environment around them. This section looks at the numbers of immigrants who come to the U.S., their ethnic communities, and the economic and cultural issues that affect these groups.
First, The Demographics
Before we explore the origins and dynamics of ethnic enclaves and communities, you may be wondering, considering that about two-thirds of all Asian Americans are immigrants, exactly how many Asians have immigrated to the U.S.? To answer that question, view Table 9.5 below (Immigration and Naturalization Service data). It shows the number of immigrants and refugees/asylees who have arrived in the U.S. for the six largest Asian origin countries, plus Hong Kong (remember, before 1997, Hong Kong was a colony of Great Britain) and all Asian countries combined, for each of the past three decades plus the latest year in which final numbers are available, 2000. Finally, it includes numbers from Europe, the Caribbean, Central and South America, and Mexico for comparison.
Table \(\PageIndex{5}\): The number of immigrants, refugees, and asylees (1971-2004). (Data from the Department of Homeland Security)
1971-1980
1981-1990
1991-2000
2001-2004
China
138,068
354,675
426,722
212,724
Hong Kong
116,935
100,131
110,390
30,336
India
164,175
250,786
365,604
267,081
Japan
49,831
47,195
67,966
31,628
Korea
267,703
333,866
164,192
74,055
Philippines
355,200
548,764
509,913
207,908
Viet Nam
323,086
605,235
493,002
144,494
All Asian Countries
1,798,861
3,450,249
3,147,019
1,332,264
All European Countries
872,226
917,062
1,786,302
738,898
Caribbean, Central & South America
1,424,865
1,924,312
2,236,032
971,635
Mexico
640,496
1,655,843
2,249,837
717,408
As you can see, the Asian ethnic country that has sent the most immigrants to the U.S. since 1971 is the Philippines (over 1.5 million since 1971), followed by India, Korea, and Viet Nam (all around 3/4 of a million). However, these numbers pale in comparison to the number of immigrants from Mexico, who total over 4.5 million since 1971 -- wow! The U.S. is truly the land of immigrants. Before we discuss the socioeconomic and cultural characteristics and impacts of Asian immigrants, let us examine how they've formed their own ethnic communities after arriving in the U.S.
Origins of Asian American Enclaves
The first Asian American enclave ("enclave" and "community" are used interchangeably) were not Chinatowns but were actually Manila Villages in Louisiana in the 1750s. But the Chinatowns that developed as increasing numbers of Chinese workers came to northern California and Hawai'i in the mid-1800s expanded the scale of such enclaves to a whole new level. As the Chinese population spread to other parts of the country, new Chinatowns spread to other major cities, such as New York City, Los Angeles, and Chicago.
But after Chinese immigration was all but stopped in the 1880s, the Japanese then followed in the steps of the Chinese and "Little Tokyos" began cropping up, first in Hawai'i, San Francisco and then in Los Angeles. As the Japanese mainly worked in agriculture, they became drawn to the relatively undeveloped land and abundant farming opportunities in Southern California. Since this period in the early 1900s, a few small Asian American communities existed throughout the country but they were relatively unnoticed for the most part.
However, it was not until the 1965 Hart-Cellar Immigration Act that the structure of Asian American enclaves changed radically. With the influx of new immigrants from China, the Philippines, Korea, India/South Asia, and Viet Nam, almost overnight new ethnic enclaves became established and quickly grew in size, almost exponentially. New enclaves soon appeared in several major U.S. cities while existing ones expanded rapidly.
Soon there were Koreatowns in Los Angeles and New York, Little Manilas in Los Angeles and San Francisco, South Asian enclaves in New York, and Little Saigons in Orange County (CA), San Jose, and Houston. By the mid-1980s, the existing Chinatown in Manhattan grew so much that there wasn't any more land into which it could expand so new Chinatowns sprang up in Sunset Park, Brooklyn and Flushing, Queens.
Today, you could find an Asian American enclave in almost every major metropolitan area you go. Some may even be in place where you would never expect, such as a thriving Hmong community in Minneapolis/St. Paul. There are also expanding Asian communities in many Canadian cities, in particular Toronto and Vancouver. Each Asian community offers its own mix of traditional culture and cuisine along with new elements borrowed from its surrounding community.
Figure \(\PageIndex{7}\): Asian Americans as a Percentage of a County's Total Population. (Used with permission, CensusScope.org /Social Science Data Analysis Network) (CC BY 4.0; via Lumens)
The map above, Figure 1.1.7, is from CensusScope/Social Science Data Analysis Network and it shows Asian Americans as a percentage of a county's total population from the 2000 census. What it basically shows, not surprisingly, is that the counties that have the largest proportion of their population as Asian American are located in California, Washington, and along the mid-Atlantic and New England states. However, there is also a scattering of counties in the midwest and Texas that, while not huge, have a notable proportion of their population as Asian as well.
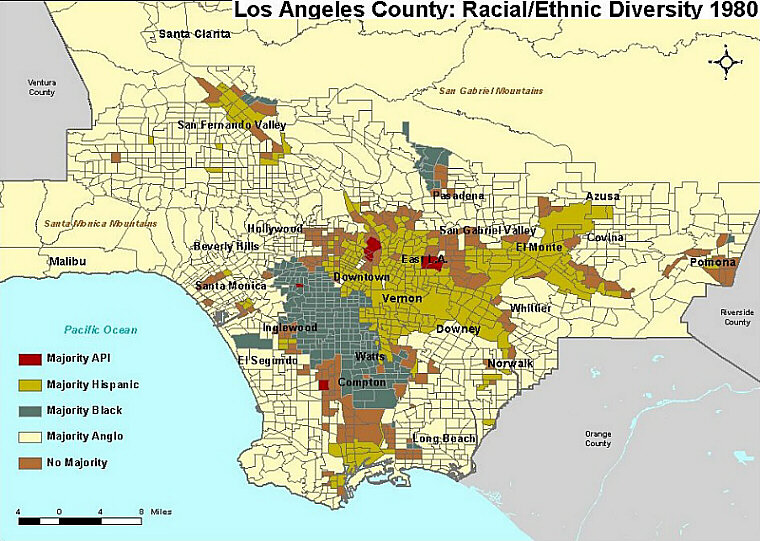
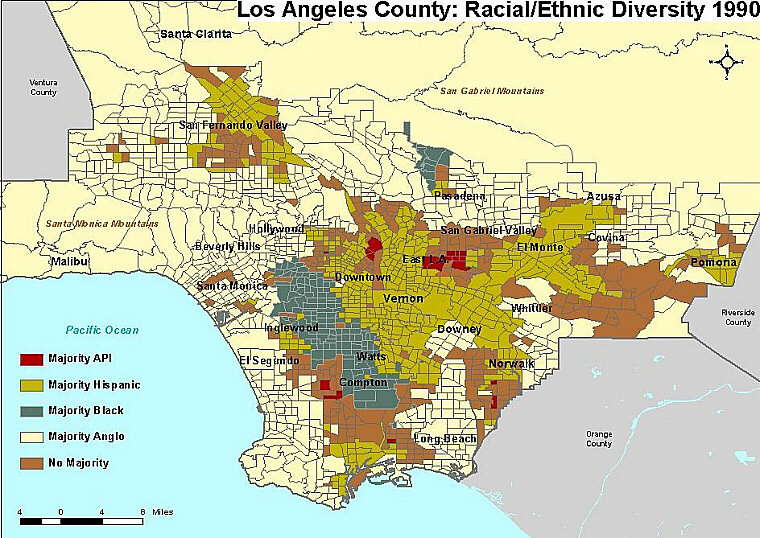
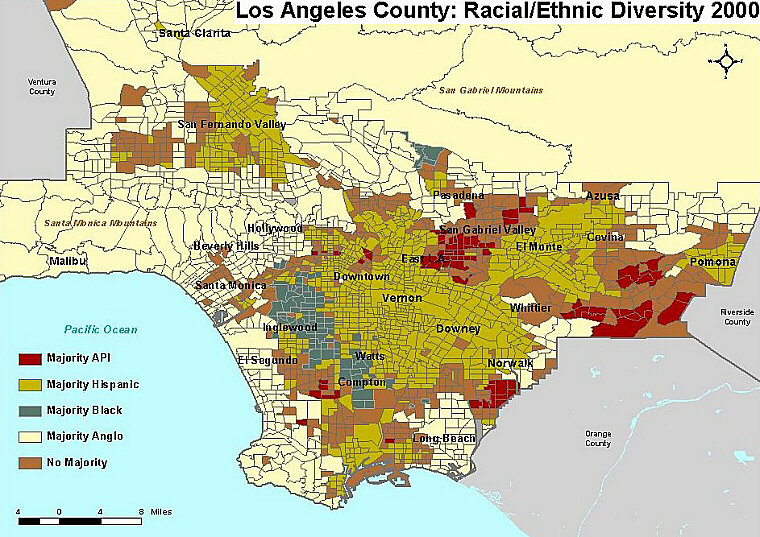
To look in more detail at perhaps the most dynamic county in the U.S. in terms of racial/ethnic diversity, the maps in Figure 1.1.8 are compiled by Michele Zonta and Paul Ong at the Ralph & Goldy Lewis Center for Regional Policy Analysis at UCLA. The maps illustrate different racial-ethnic distributions and concentrations in cities within Los Angeles (L.A.) County for 1980, 1990, and 2000. The results show that in 1980, the only cities that had an Asian Pacific Islander (API) majority were ones directly north of downtown and in east L.A. However, by 1990, more API majorities sprung up in east L.A. and west of Compton. Most recently in 2000, API majorities have expanded to include most of east L.A. and San Gabriel and much of the eastern part of the county.
Figure \(\PageIndex{8}\): Growth of API in Southern California. (Courtesy of Asian-Nation.org)
Multiracial/Hapa Asian Americans
Asian Americans of mixed racial ancestry have been referred to as multiracial, mixed-race, biracial, "Hapa" (a native Hawaiian term that originally meant half Hawaiian), and Amerasian, among others. Their presence in not only the Asian American community but also in mainstream American society has a long history. However, the political, demographic, and cultural implications of their increasing numbers have only recently emerged for both Asian Americans and non-Asians alike.
Evolution of Racial Identity Among Asians
The origin of mixed-race or multiracial Asian Americans can be traced back to the early period of Asian immigration to the U.S. in the mid-1700s, with large scale migrations common by the mid-1800s. Because the vast majority of these early Asian immigrants were men (mostly from the Philippines or China), in many instances, if they wanted to be in the company of women, these early Asian immigrants had little choice but to socialize with non-Asian women. Eventually, the children from these interracial unions became the first multiracial Asian Americans, especially in Hawai'i where Chinese-Native Hawaiian intermarriages were common.
Eventually, as the numbers of immigrants from Asia began to swell in the mid- and late-1800s, the native white population increasingly began to view their presence in the U.S. with hostility. Objections were raised concerning perceived economic competition with native U.S. workers that Asian immigrants supposedly posed, along with doubts over whether Asians were cultural and racially compatible with mainstream American society.
This nativist and xenophobic backlash, popularly characterized as the "anti-Chinese movement," eventually led to several pieces of legislation at the local, state, and federal levels, culminating with the Chinese Exclusion Act of 1882. These laws restricted the rights and activities of first, Chinese immigrants, then later broadened to include virtually all subsequent immigrants from Asia. Included in these restrictive laws were anti-miscegenation provisions that prevented Asians from marrying whites.
These anti-miscegenation laws were first passed in the 1600s to prevent freed Black slaves from marrying whites. Later versions added persons of Asian origin or ancestry to the list of groups forbidden to marry whites. While early examples of such anti-miscegenation laws singled out those of "Mongoloid" origin specifically, they were later amended to include Filipinos (who claimed that they were of "Malay" origin) and Asian Indians (who characterized themselves as "Aryan" in origin).
Figure \(\PageIndex{9}\): The pursuit of Hapa-ness. (Thinkstock.com via Asian-Nation.org)
One noteworthy exception was the War Brides Act of 1945 that allowed American GIs to marry and bring over wives from Japan, China, the Philippines, and Korea. Several thousands of Asian women immigrated to the U.S. as war brides and their offspring became the first notable cohort of multiracial Asian Americans. Anti-miscegenation laws were finally declared unconstitutional in the 1967 U.S. Supreme Court Loving v. Virginia case.
Interracial marriages involving Asian Americans and their multiracial offspring started to increase significantly following the passage of the Immigration Act of 1965. This Act replaced the restrictive National Origins quota system that had been in place for the past four decades and which effectively limited the number of Asian immigrants to a token few each year.
In its place, the 1965 Immigration Act was structured around provisions that favored the immigration of family members, relatives, and professional workers. Eventually, these provisions substantially increased the numbers of Asian immigrants coming to the U.S., which in turn significantly increased the marriage pool, or the numbers of potential marriage partners, for Asians and non-Asians alike.
The end of the Viet Nam War also played an important role in increasing the numbers and visibility of multiracial Asian Americans, in this case "Amerasians" -- the children of Vietnamese mothers and American GIs who served in Viet Nam. After the fall of Saigon in and the reunification of Viet Nam in 1975, several thousand Amerasians were left behind as all remaining American personnel were evacuated. After enduring systematic discrimination and hostility back in Viet Nam as direct legacies of the U.S.'s involvement in the war, the Vietnamese Amerasian Homecoming Act of 1988 allowed approximately 25,000 Amerasians and their immediate relatives to immigrate to the U.S.
Characteristics and Demographics of Multiracials
Efforts to get an accurate national count of multiracial Asian Americans have been stymied in previous censuses since respondents could not choose more than one racial/ethnic identity. However, for the 2000 Census, the Census Bureau reversed its policy and allowed respondents to identify with more than one "race," finally allowing researchers to get a reliable count of the number of multiracial Asian Americans in the U.S.
According to the 2000 census, (The Asian Population: 2000), out of the 281,421,906 people living in the U.S., 10,242,998 of them identified themselves as entirely of Asian race (3.6%). Additionally, there were 1,655,830 people who identified themselves as being part Asian and part one or more other races (as noted in the Methodology explanation, the Census Bureau considers Hispanics/Latinos to be an ethnic, rather than a racial, group). The following table breaks down the distributions of Asian Americans who identify with more than one race.
Table \(\PageIndex{10}\): Number of Multiracial Asians by Racial/Ethnic Combinations, 2000. (Data via U.S. Census Bureau)
Number of Multiracial Asians by Racial/Ethnic Combinations, 2000
Number
% of all Multiracial Asians
Asian and Other Race(s)
1,655,830
100%
Asian and white
868,395
52.4%
Asian and Native Hawaiian/Pacific Islander
138,802
8.4%
Asian and Black/African American
106,782
6.4%
Asian and Some Other Race
249,108
15.0%
All Other Combinations, incl. Other Asian
292,743
17.7%
All Asians Alone or with Other Races
11,898,828
4.2% of Total U.S. Population
As we can see, by far the largest group of multiracial Asians are those who are half Asian and half white. Historically, many of these mixed-race Asians have also been called "Amerasians." These include older multiracial Asian Americans who are the children of war brides and U.S. military personnel stationed in countries such as Japan, the Philippines, and South Korea, along with those who are the result of more recent non-military interracial marriages involving Asian Americans.
The Hapa Issues Forum quotes a recent Congressional Record report that indicated "between 1968 and 1989, children born to parents of different races increased from 1% of total births to 3.4%." The 2000 Census further shows that 30.7% of those who identify as at least part Japanese are multiracial, the highest proportion among the six largest Asian American ethnic groups. Next are Filipinos (21.8% of whom are multiracial), Chinese (15.4%), Korean (12.3%), Asian Indian (11.6%), and Vietnamese (8.3%).
Overall, the Census Bureau reports that there are about 1.8 million Americans who identify has half-Asian and half one or more other races. Of these, 52% are half -Asian and half-white. If we include all multiracial Asian Americans as their own "ethnic" group, they would be the fourth-largest group, comprising 8% of the entire Asian American population. Multiracial Asian Americans would also be the fastest-growing group as well.
In fact, demographers predict that by the year 2020 almost 20% of all Asian Americans will be multiracial and that figure will climb to 36% by the year 2050. In other words, as intermarriages involving Asians increase, multiracial Asians are becoming a more prominent group within the Asian American community, and within mainstream American society in general.
Pacific Islanders
Until 1980, "Hawaiian" was the only pacific islander group listed on the Census questionnaire; Guamanian and Samoan were added in 1990 and the census category today, reads "Native Hawaiian or Other Pacific Islander". There are an estimated 1.4 million people who identify with this category in the United States, 41% of which identify as Native Hawaiian, with the remainder identifying as Samoan (13%), Guamanian (10%), Tongan (5%), Fijian (3%), Marshallese (2%) or other Pacific Islander (26%) (Ramakrishnan & Ahmad, 2014). Scholars have argued that because these groups face a different struggles with Pacific Islanders contending with issues relating to sovereignty and decolonization, and Asian Americans dealing with immigration, they deserved a label distinct from "Asian American." Given these dynamics, it is argued that the experience of Pacific Islanders is much more akin to that of Native Americans (Ishisaka, 2020).
Native Hawaiians
In 1778, the year that Captain James Cook of England arrived, the estimated population of Hawaiians was between 400,000 and 800,000. In 1893 U.S. naval forces overthrew the monarchy originally founded in 1810 by King Kamehameha I, then in 1898 the Hawaiian islands were annexed by the United States as the Republic of Hawai'i. Much like the experience of Native Americans, European diseases introduced by colonization brought the population down to 29,800 Native Hawaiians and another 7,800 Hawaiians of mixed ancestry by 1900. Today, Native Hawaiians in Hawaii experience lower incomes, have the highest unemployment rate, and hold lower status jobs when compared to all ethnic groups in the islands. As is the case with other marginalized groups, this lower socioeconomic position leaves Native Hawaiians more vulnerable to health disparities such as lower mortality rates and higher rates of disease and cancer (Lai & Arguelles, 2003).
As an indigenous minority group, Native Hawaiians are recognized as having a "special trust relationship" with the U.S. government, similar to Native American Indians (along with Native Alaskans), entitling them to special programs and resources. However, in February 2000, the U.S. Supreme Court reversed established policies of the U.S. Congress and ruled that the composition of the trustees who control Native Hawaiian rights and entitlements (the Office of Hawaiian Affairs, or OHA) was unconstitutional because they were based on racial identity qualifications. This decision basically throws into question the fundamental rights of Native Hawaiians.
In light of the ruling, Hawai'i's two Senators, Daniel Akaka and Daniel Inouye introduced the "Native Hawaiian Government Reorganization Act" (aka the "Akaka Bill") before Congress in 2000. The bill would formally extend the federal policy of self-determination to Native Hawaiians and put them on the same legal status as Native American Indians. Opponents of the bill argue that it promotes racial/ethnic separatism and that similar to debates about affirmative action, non-Hawaiians should not unfairly bear the consequences of reconciling events that occurred several generations ago.
Hawaiians have a saying, Aloha mai no, aloha aku -- When love is given, love should be returned. Sovereignty supporters believe that now is the time for aloha to be acknowledged and returned to the Native Hawaiian people and their descendents. The Akaka bill would provide an avenue for both the people of Hawai'i and the U.S. Congress to correct the historical injustices they have suffered collectively as a people, and enable them to exercise self-determination through self-governance, in order to heal as a people.
The House version of the bill (H.R. 505) passed on October 24, 2007 and the Senate version is still being considered.
Samoans & Guamanians
According to the United States Census Bureau, there are approximately 204,000 Samoan people including those with partial Samoan ancestry and about 160,000 Guamanians in the United States (United States Census Bureau, 2019).
Like the Native Hawaiians, they are considered Polynesians, and are theorized to have migrated from the west (the East Indies, the Malay peninsula or the Philippines) as far back ago as 1,000 B.C.E. Today, the islands are divided up into American Samoa and Samoa. The former is only 76 square miles, has a population of around 67,000, and sends a delegate to the U.S. Congress. Samoa, known as Western Samoa until 1997, is an independent nation with islands totaling 1,090 square miles, and a population of 179,058.
The economy of American Samoa remains undeveloped; nearly one-third of workers are employed in the fishing or canning industry. Tourism has not taken off. In recent years, one of American Samoa's main exports has been football players. There are more than 200 playing Division I college football, and 28 in the NFL, reported ESPN in 2002. Perhaps the most famous has been linebacker Tiaina "Junior" Seau.
After Samoans, the next-largest NHPI group are the natives of the island of Guam, also known as Chamorro. There are only about 157,000 people living on today's multicultural Guam, of whom about half are Chamorro. So like American Samoa, a larger number of Chamorro actually live abroad-in the U.S., there are nearly 93,000 people of pure or part-Chamorro descent.
Today the U.S. military maintains a large, albeit declining, presence in Guam, with 23,000 military personnel and their families living on the island. Though the government has lobbied to free Guam from its "unincorporated" U.S. territory status, the island has yet to be granted the Commonwealth recognition given Puerto Rico. And although the people are given U.S. citizenship, they do not vote in U.S. presidential elections. Economically, the growing tourist industry catering to Japanese visitors has helped offset the military downsizing.
Anderson, W., Johnson, M., & Brookes, B. (Eds.). (2018). Pacific Futures: Past and Present. Honolulu, HI: University of Hawai'i Press.
Wang, C. (2013). Transpacific Articulations: Student Migration and the Remaking of Asian America. Honolulu, HI: University of Hawai'i Press.
Aguilar-San Juan, K.(2009). Little Saigons: Staying Vietnamese in America. Minneapolis, MN: University of Minnesota Press.
Chang, S.H. (2015). Raising Mixed Race: Multiracial Asian Children in a Post-Racial World. New York, NY: Routledge.
Fojas, C., Rudy P. Guevarra Jr., R.P., & Tamar Sharma, N. (Eds.). (2019). Beyond Ethnicity: New Politics of Race in Hawai‘i. Honolulu, HI: University of Hawai'i Press.
Gates, P. (2019). Criminalization/Assimilation: Chinese/Americans and Chinatowns in Classical Hollywood Film. New Brunswick, CN: Rutgers University Press.
Ho, J. (2015). Racial Ambiguity in Asian American Culture. New Brunswick, CN: Rutgers University Press.
Hoskins, J.A., & Nguyen, V.T. (Eds.). (2014). Transpacific Studies: Framing an Emerging Field. Honolulu, HI: University of Hawai'i Press.
Inouye, D.H. (2018). Distant Islands: The Japanese American Community in New York City, 1876-1930s. Boulder, CO: University Press of Colorado.
Irwin, K. & Umemoto, K. (2016). Jacked Up and Unjust: Pacific Islander Teens Confront Violent Legacies. Oakland, CA: University of California Press.
Ishisaka, N. (2020, November 30). Why it's time to retire the term 'Asian Pacific Islander.' Seattle Times.
Kang, M. (2010). The Managed Hand: Race, Gender and the Body in Beauty Service Work. Berkeley, CA: University of California Press.
Kauanui, J.K. (2018). Paradoxes of Hawaiian Sovereignty: Land, Sex, and the Colonial Politics of State Nationalism. Durham, NC: Duke University Press.
Khanna, N. (2011). Biracial in America: Forming and Performing Racial Identity. Washington, D.C: Lexington Books.
Kim, J. (2019). Postcolonial Grief: The Afterlives of the Pacific Wars in the Americas. Durham, NC: Duke University Press.
Kina, L. (2013). War Baby / Love Child: Mixed Race Asian American Art. Seattle, WA: University of Washington Press.
Künnemann, V. & Mayer, R. (Eds.). (2011). Chinatowns in a Transnational World: Myths and Realities of an Urban Phenomenon. New York, NY: Routledge.
Kurashige, L. (Ed.). (2017). Pacific America: Histories of Transoceanic Crossings. Honolulu, HI: University of Hawai’i Press.
Lai, E.Y.P., & Arguelles, D. (2003). The New Face of Asian Pacific America: Numbers, Diversity & Change in the 21st Century. San Francisco, CA: AsianWeek, with UCLA's Asian American Studies Center Press, in cooperation with the Organization of Chinese Americans and the National Coalition for Asian Pacific American Community Development.
Ling, H. (Ed.). (2009). Asian America: Forming New Communities, Expanding Boundaries. New Brunswick, CN: Rutgers University Press.
Liu, B. (Ed.). (2017). Solving the Mystery of the Model Minority: The Journey of Asian Americans in America. New York, NY: Cognella Academic Publishing.
Low, S. (2019). Hawaiki Rising: Hokule‘a, Nainoa Thompson, and the Hawaiian Renaissance. Honolulu, HI: University of Hawai'i Press.
Lung-Amam, W. (2017). Trespassers?: Asian Americans and the Battle for Suburbia. Oakland, CA: University of California Press.
Murphy-Shigematsu, S. (2012). When Half Is Whole: Multiethnic Asian American Identities. Palo Alto, CA: Stanford University Press.
Nguyen, P.T. (2017). Becoming Refugee American: The Politics of Rescue in Little Saigon. Urbana, IL: University of Illinois Press.
Nishime, L. (2014). Undercover Asian: Multiracial Asian Americans in Visual Culture. Urbana, IL: University of Illinois Press.
Parrenas, R. & Lok, S. (Eds.). (2007). Asian Diasporas: New Formations, New Conceptions. Palo Alto, CA: Stanford University Press.
Ramakrishnan, K. & Ahmad, F.A. (2014). State of Asian Americans and Pacific Islanders Series. Center for American Progress. Washington: DC.
Rondilla, J.L., Guevarra Jr., R.P., & Spickard, P (Eds.). (2017). Red and Yellow, Black and Brown: Decentering Whiteness in Mixed Race Studies Paperback. New Brunswick, CN: Rutgers University Press.
Saranillio, D.I. (2018). Unsustainable Empire: Alternative Histories of Hawai‘i Statehood. Durham, NC: Duke University Press.
Schlund-Vials, C.J., Forbes, S.F. and Betts, T (Eds.). (2017). The Beiging of America: Personal Narratives About Being Mixed Race in the 21st Century. New York, NY: 2Leaf Press.
Strmic-Pawl, H.V. (2016). Multiracialism and Its Discontents: A Comparative Analysis of Asian-White and Black-White Multiracials. Washington, D.C: Lexington Books.
Tsui, B. (2009). American Chinatown: A People's History of Five Neighborhoods. New York, NY: Free Press.