
1.2: How Economists Use Theories and Models to Understand Economic Issues
- Page ID
- 52803

Learning Objectives
- Explain the Economists Toolkit, which includes abstraction, models and theories
- Interpret a simple model known as "The Circular Flow" diagram
- Describe goods and services markets and labor markets
- Apply these concepts to the American economy
John Maynard Keynes (1883–1946), one of the greatest economists of the twentieth century, pointed out that economics is not just a subject area but also a way of thinking. Keynes, shown in Figure \(\PageIndex{1}\), famously wrote in the introduction to a fellow economist’s book: “[Economics] is a method rather than a doctrine, an apparatus of the mind, a technique of thinking, which helps its possessor to draw correct conclusions.” In other words, economics teaches you how to think, not what to think.
The Economists Tool Kit
Economics is a social science which is different from the natural and physical sciences because it studies human behavior. Of course, humans behave in differing ways and with many more complications at times than the natural environment. Therefore, economists and other social scientists use several tools. They study history to better understand current and future events and institutions. They use mathematic reasoning to help explain events and phenomenon that they observe. They also use statistics to make inferences about data that they collect.
They also use a technique known as abstraction to simplify their tasks. Abstraction means to oversimplify a problem so that a researcher only focuses on the primary or important details in order to ignore the unnecessary ones.
Abstraction helps economists create economic models that can more easily represent and explain the complex world that they are studying. In more academic language, an economic model is a theoretical construct representing economic processes by a set of variables and a set of logical and/or quantitative relationships between them. This allows economists to derive hypothesis, or testable questions. Once these questions are tested and retested numerous times, they become adopted as the general set of principles in the field or the theories.
For example, many economists wondered what would happen if the government raised the minimum wage. This is a testable question or hypothesis. Economists set up many tests of this hypotheses. They tested the question for teens, restaurant workers, individuals who worked in retail, those in urban areas, in more 100 studies, The Federal Reserve Bank of San Francisco summarizes the findings and concludes that there is very little, if any, unemployment caused by raising the minimum wage. Therefore, the theory most widely accepted by most economists is that raising the minimum wage does not cause much, if any, minimum wage.
The Federal Reserve has summarized this research in their article entitled “The Effects of Minimum Wage on Employment”
Many people note, however, that there is an increase in some unemployment. Why is this occurring? Raising the minimum wage can create an environment where people who were not in the labor force wish to enter at the new higher wage (I won’t work for $10/hr but I will for $15/hr). However, since they haven’t been in the labor force, their employability is lower than those already in the labor force. This may take them a little time to find work as a result. In other words, the labor demand curve is highly inelastic but the labor supply curve is elastic (elasticity will be discussed in an upcoming chapter).
Correlation vs Causation
It is important to note that just because two events are correlated, that does not mean they are caused by one another. Moreover, the direction of the causation is important to note. For example, when it rains there are more accidents on the freeway. One could conclude that the accidents caused the rain. This would be a fallacious causal relationship. Therefore, it is important to consider all of the factors when attempting to determine correlation and causation.
Sometimes economists use the term model instead of theory. Strictly speaking, a theory is a more abstract representation, while a model is more applied or empirical representation. Models are used to test theories, but for this course we will use the terms interchangeably.
For example, an architect who is planning a major office building will often build a physical model that sits on a tabletop to show how the entire city block will look after the new building is constructed. Companies often build models of their new products, which are more rough and unfinished than the final product will be, but can still demonstrate how the new product will work.
The Circular Flow of Goods and Services
A good model to start with in economics is the circular flow diagram, which is shown in Figure \(\PageIndex{2}\). It pictures the economy as consisting of two groups—households and firms—that interact in two markets: the goods and services market in which firms sell and households buy and the labor market in which households sell labor to business firms or other employees.
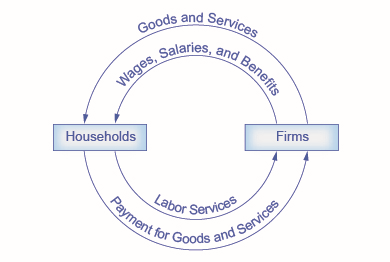
Of course, in the real world, there are many different markets for goods and services and markets for many different types of labor. The circular flow diagram simplifies this to make the picture easier to grasp. In the diagram, firms produce goods and services, which they sell to households in return for revenues. This is shown in the outer circle, and represents the two sides of the product market (for example, the market for goods and services) in which households demand and firms supply. Households sell their labor as workers to firms in return for wages, salaries and benefits. This is shown in the inner circle and represents the two sides of the labor market in which households supply and firms demand. The labor market is an important market because households earn a majority of their income from this market and also because it comprises the largest cost for most firms. However, firms also pay rent for land and interest payments for capital.
This version of the circular flow model is stripped down to the essentials, but it has enough features to explain how the product and labor markets work in the economy. We could easily add details to this basic model if we wanted to introduce more real-world elements, like financial markets, governments, and interactions with the rest of the globe (imports and exports).
Economists carry a set of theories in their heads like a carpenter carries around a toolkit. When they see an economic issue or problem, they go through the theories they know to see if they can find one that fits. Then they use the theory to derive insights about the issue or problem. In economics, theories are expressed as diagrams, graphs, or even as mathematical equations. (Do not worry. In this course, we will mostly use graphs.) Economists do not figure out the answer to the problem first and then draw the graph to illustrate. Rather, they use the graph of the theory to help them figure out the answer. Although at the introductory level, you can sometimes figure out the right answer without applying a model, if you keep studying economics, before too long you will run into issues and problems that you will need to graph to solve. Both micro and macroeconomics are explained in terms of theories and models. The most well-known theories are probably those of supply and demand, but you will learn a number of others.
The American Economy
Current Size of the US Economy and US Population
Currently the US Economy produces the most goods and services in the world with the third largest population, according to the World Population Review.
Before the Industrial Revolution most workers in the U.S. were employed as subsistence agricultural producers, who worked on their own farms, producing for their own consumption. Currently, only 1.5% of the labor force is employed in agriculture. Since the 1970s, we have also seen a steady decline in the manufacturing sector with only a little more than 10% of the labor force employed in the manufacturing sector and the remaining 80%+ employed in the service sector, in such fields as finance and banking.
GDP Growth Over Time
The following graph published by the Federal Reserve Bank of St. Louis illustrates the growth rate of GDP over time from 1947 to the present.
It illustrates a few facts:
- Growth has been uneven over time. However, fiscal and monetary policy seem to have lessened the severity of recessions and the high growth spurts since about the mid-1960s.
- After women entered into the labor force in the 1960s, the growth rate of GDP increased.
- Wars increase the GDP growth rate but every time the war ends, the transition to civilian goods tends to reduce the growth rate of GDP and the economy typically experiences a recession or slowing growth.
US Trade and Connection to World Economies
The US is considered a relatively closed economy. In other words, the US trades a small fraction of its goods or services annually. The OECD tracks the percentage of GDP that is imported and exported annually major nations. According to the data, the US exports 12% of GDP and imports 15% of GDP in 2016.
Which other nations export significantly more of their GDP? These nations are considered relatively more “open”.
Key Concepts and Summary
Economists analyze problems differently than do other disciplinary experts. The main tools economists use are economic theories or models. A theory is not an illustration of the answer to a problem. Rather, a theory is a tool for determining the answer.
Glossary
- circular flow diagram
- a diagram that views the economy as consisting of households and firms interacting in a goods and services market and a labor market
- goods and services market
- a market in which firms are sellers of what they produce and households are buyers
- labor market
- the market in which households sell their labor as workers to business firms or other employers
- model
- see theory
- theory
- a representation of an object or situation that is simplified while including enough of the key features to help us understand the object or situation