Probably the best way to begin to understand racial and ethnic inequality, how it operates and how it is experienced in the United States, is to read first-hand accounts by such great writers of color as Maya Angelou, Toni Morrison, Piri Thomas, Richard Wright, and Malcolm X. Sociologists and urban ethnographers have written their own accounts of the daily lives of people of color, and these, too, are well worth reading. One of the classics is Elliot Liebow’s (1967) Tally’s Corner, a study of Black men and their families in Washington, DC.
Statistics also help us understand the historical and contemporary effects of racial and ethnic inequality in the United States. We can begin to get a picture of this inequality by examining racial and ethnic differences in such life chances as high school and college graduation rates, household income, home ownership, unemployment, and poverty rates, as provided in the table below. The data for Native Americans is not provided in here, but their numbers resembles Black and Latinx populations. For example, according to the Pew Research Center, in 2012, 17% of Native Americans earned a college degree while the poverty rate for Native Americans was 26%.
Socioeconomic Indicators
Black
AAPI
White
Latinx
High School Completion (% of 25 years adults)
88
89
93
67
College Degree (% of 25 year+ adults)
23
53
36
15
Household Income
$43,000
$77,900
$71,300
$43,000
Home Ownership (% of Householders Owning a Home)
43
57
72
45
Unemployment Rate (%)
10.3
3.6
4.5
7.6
Poverty (% in poverty)
26
12
10
24
Although the above table shows that Black and Latinx individuals fare much worse than whites, it presents a more complex pattern for Asian Americans. Compared to whites, Asian Americans have higher family incomes and are more likely to hold college degrees, but they also have a higher poverty rate. Thus many Asian Americans do relatively well, while others fare relatively worse, as just noted. Although Asian Americans are often viewed as a “model minority,” meaning that they have achieved economic success despite not being white, some Asians have been less able than others to climb the economic ladder. Moreover, stereotypes of Asian Americans and discrimination against them remain serious problems (Chou & Feagin, 2008). Even the overall success rate of Asian Americans obscures the fact that their occupations and incomes are often lower than would be expected from their educational attainment. They thus have to work harder for their success than whites do (Hurh & Kim, 1999).
To expand upon the ideas presented thus far, we need to bring our attention to the nation's growing racial wealth gap. A persistent racial wealth gap has characterized U.S. history. The median net worth for white households has far exceeded that of Black households through recessions and booms over the last three decades. Following the Great Recession, the median net worth for Black families declined more than for white families. In fact, the ratio of white family wealth to Black family wealth is higher today than at the start of the century, with white family wealth netting ten times more than Black family wealth (McIntosh, Moss, Nunn & Shambaugh, 2020).
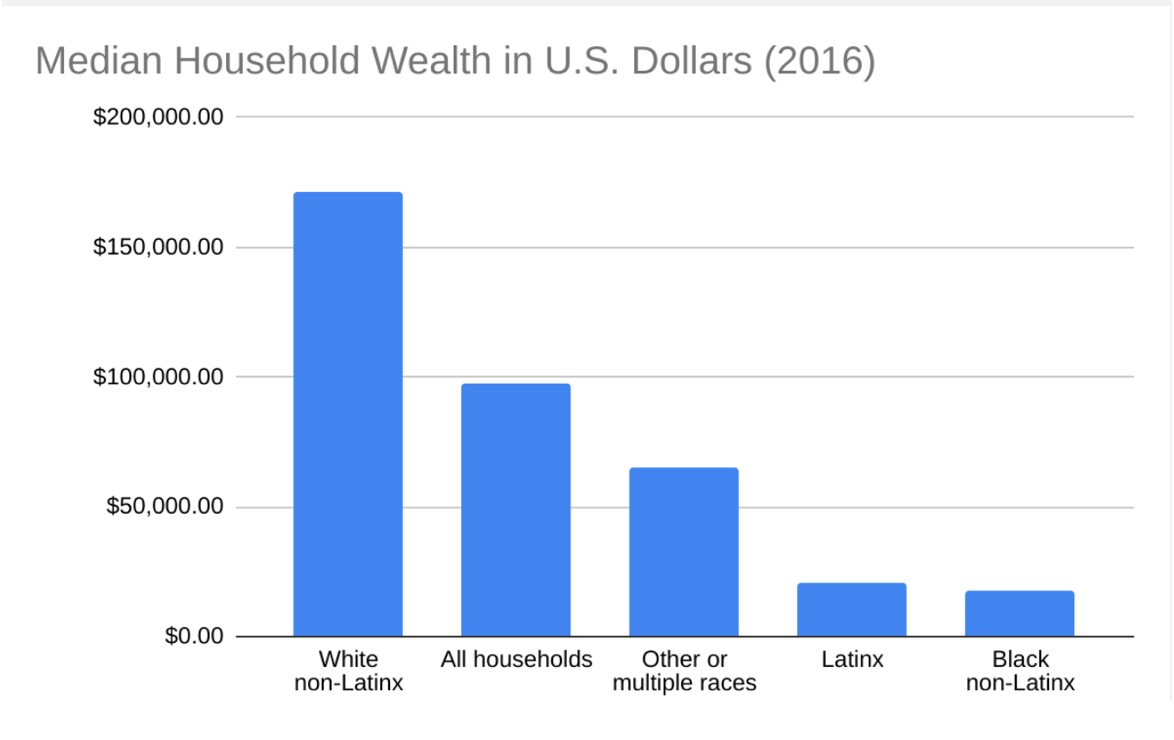
Furthermore, a large racial/ethnic gap also exists in the percentage of families with negative net worth—that is, those whose debts exceed their assets. One-third of Black and Latino households had negative net worth, compared to only 15 percent of white households. Black and Latino households were thus more than twice as likely as white households to be in debt. The figure below provides a glimpse at the 2016 racial wealth gap.
Figure \(\PageIndex{9}\): Median Household Wealth in U.S. Dollars (2016). While all households averaged just under $100,000 in wealth, white non-Latinx household held more than $160,000 in wealth with Latinx and Black households averaging well under $20,000. Other or multiple races households averaged approximately $60,000 in wealth. (Chart created by Jonas Oware with data from Statista)
The data is clear: U.S. racial and ethnic groups differ dramatically in their life chances. Compared to Whites, for example, Blacks, Latinx, and Native Americans have much lower family incomes and much higher rates of poverty; they are also much less likely to have college degrees. In addition, Blacks and Native Americans have much higher infant mortality rates than whites: Black infants, for example, are more than twice as likely as white infants to die. Still, these comparisons obscure some differences within some of the groups just mentioned. Among Latinos, for example, Cuban Americans have fared better than Latinos overall, and Puerto Ricans worse. Similarly, among Asian American Pacific Islanders (AAPI), people with Chinese and Japanese backgrounds have fared better than those from Cambodia, Korea, and Vietnam.
The question we want to pursue is why do the charts reflect such inequality? In addition to daily, individual prejudice and discrimination are the other, larger forces at play that encourage such outcomes? Indeed, there are. Before moving on to the next page, please watch the video below to learn about what has contributed to the racial wealth gap.
RACE – THE POWER OF AN ILLUSION: How the Racial Wealth Gap Was Created from California Newsreel on Vimeo.
Video \(\PageIndex{10}\): Race - The Power of an Illusion: How the Racial Wealth Gap Was Created. (Close-captioning and other settings appear at the bottom of the screen.) (Fair Use; California Newsreel via Vimeo)