Immigration is the act of foreigners passing or coming into a country for the purpose of permanent residence. Immigration occurs for many reasons, including economic, political, family re-unification, natural disasters, or poverty. Many immigrants came to America to escape religious persecution or dire economic conditions. Most hoped coming to America would provide freedom and opportunity.
Immigration to the United States has been a major source of population growth and cultural change. Different historical periods have brought distinct national groups, races and ethnicities to the United States. During the 17th century, approximately 175,000 Englishmen migrated to Colonial America. Over half of all European immigrants to Colonial America during the 17th and 18th centuries arrived as indentured servants. The mid-nineteenth century saw mainly an influx from northern Europe, the early twentieth-century mainly from Southern and Eastern Europe, and post-1965 mostly from Latin America and Asia.
For a striking look at the history of immigration to the United States, please watch the video below by Metrocosm:
Contemporary Immigration
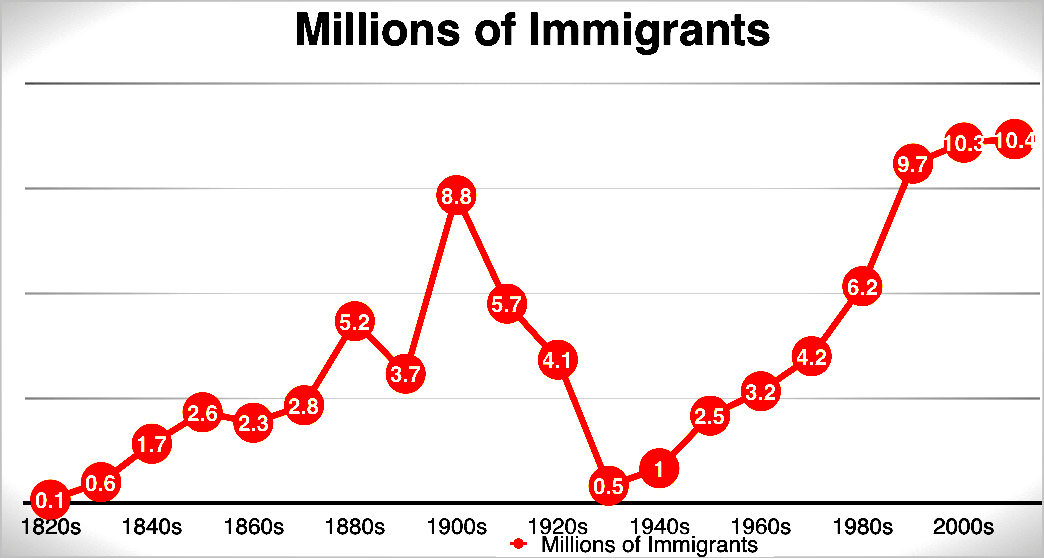
In recent years, immigration has increased substantially which is conveyed in the Figure 3.1.2 below. In 1965, ethnic quotas were removed; these quotas had restricted the number of immigrants allowed from different parts of the world. Immigration doubled between 1965 and 1970, and again between 1970 and 1990. Between 2000 and 2005, nearly 8 million immigrants entered the United States, more than in any other five-year period in the nation’s history. In 2006, the United States accepted more legal immigrants as permanent residents than all other countries in the world combined. Though, as Table 3.1.3 reveals, fewer individuals received their authorized permanent resident status from 2016 through 2018. According to the U. S. and World Population Clock provided by the United States Census Bureau, the most current U. S. population count is 330,065,778 and rising.
Figure 3.1.2: Legal Immigration in the United States, 1820-2020
Data from Schaefer, 2015; United States Department of Homeland Security, 2013
Recent Immigration Demographics
Until the 1930s most legal immigrants were male. By the 1990s, women accounted for just over half of all legal immigrants. Contemporary immigrants tend to be younger than the native population of the United States, with people between the ages of 15 and 34 substantially over-represented. Immigrants are also more likely to be married and less likely to be divorced than native-born Americans of the same age.
Immigrants come from all over the world, but a significant number come from Latin America. In 1900, when the U.S. population was 76 million, there were an estimated 500,000 Latinx. The Census Bureau projects that by 2050, one-quarter of the population will be of Hispanic descent. This demographic shift is jointly fueled by higher fertility rates amongst the Latinx population as well as immigration from Latin America.
Although Europe has been the traditional sending region for immigrants to the U.S., the post WWII era (after 1946) shows a significant increase in migration from Mexico, South and Central America, the Caribbean, and Asia. The latest migration trend also involves people from Africa. Please visit the following websites for more information: Foreign Born Data Tables and The Statistical Abstracts of the United States.
Public Opinion Toward Immigrants
American attitudes toward immigration are markedly ambivalent. American history is rife with examples of anti-immigrant opinion. Benjamin Franklin opposed German immigration, warning Germans would not assimilate. In the 1850s, the nativist Know Nothing movement opposed Irish immigration, promulgating fears that the country was being overwhelmed by Irish Catholic immigrants.
In general, Americans have more positive attitudes toward groups that have been visible for a century or more, and much more negative attitude toward recent arrivals. According to a 1982 national poll by the Roper Center at the University of Connecticut, “By high margins, Americans are telling pollsters it was a very good thing that Poles, Italians, and Jews emigrated to America. Once again, it’s the newcomers who are viewed with suspicion. This time, it’s the Mexicans, the Filipinos, and the people from the Caribbean who make Americans nervous.”
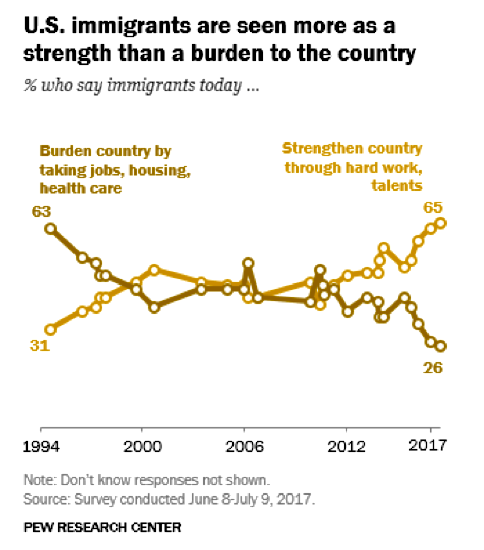
One of the most important factors regarding public opinion about immigration is the level of unemployment; anti-immigrant sentiment is highest where unemployment is highest, and vice versa. In fact, in the United States, only 0.16% of the workforce are legal immigrants. A more recent survey by the Pew Research Center (see Figure 3.1.6 below) suggests a more positive view of U. S. immigrants in which they are seen as a source of "strength."
Figure \(\PageIndex{6}\): U. S. Immigrants are Seen More as a Strength than a Burden to the Country (Used with permission; Pew Research Center, Washington, D.C.)
Unauthorized Immigration to the United States
Unauthorized immigration refers to to the act of entering the United States without governmental permission and in violation of the United States Nationality Law, or staying beyond the termination date of a visa, also in violation of the law. An undocumented immigrant in the United States is a person (non-citizen) who has entered the United States without government permission and in violation of United States Nationality Law, or stayed beyond the termination date of a visa, also in violation of the law. The undocumented immigrant population is estimated to be between 7 and 20 million. More than 50% of undocumented immigrants are from Mexico.
While the majority of undocumented immigrants continue to concentrate in places with existing large Hispanic communities, undocumented immigrants are increasingly settling throughout the rest of the country. A percentage of undocumented immigrants do not remain indefinitely but do return to their country of origin; they are often referred to as sojourners, which are people that leave or emigrate from their home country with the intention of returning to their homeland one day.
The continuing practice of hiring unauthorized workers has been referred to as the magnet for unauthorized immigration. As a significant percentage of employers are willing to hire undocumented immigrants for higher pay than they would typically receive in their former country, undocumented immigrants have prime motivation to cross borders.
Refugees, Asylum Seekers, and Internally Displaced People
In 2013, the number of refugees, asylum-seekers, and internally displaced people worldwide exceeded 50 million people for the first time since the end of World War II. Half these people were children. A refugee is defined as an individual who has been forced to leave their country in order to escape war, persecution, or natural disaster, while asylum-seekers are those whose claim to refugee status has not been validated. An internally displaced person, on the other hand, is neither a refugee nor an asylum-seeker (Ritzer, 2015).
The war in Syria caused most of the 2013 increase, forcing 2.5 million people to seek refugee status while internally displacing an additional 6.5 million. Violence in Central African Republic and South Sudan also contributed a large number of people to the total (United Nations, 2014). Refugees need help in the form of food, water, shelter, and medical care, which has worldwide implications for nations contributing foreign aid, the nations hosting the refugees, and the non-government organizations (NGOs) working with individuals and groups on site (United Nations, 2014). Where will this large moving population, including the sick, elderly, children, and people with very few possessions and no long-term plan, go? What role should the U.S. play in the face of the needs of refugees?
Given current immigration policies, specifically admissions ceilings, the United States is not a frequent destination for refugees and asylum-seekers, although it is sought out by displaced individuals. This means that as of September 2019, there was 339,386 pending asylum applications. However, in 2018, only 25,439 people were granted asylum. As far as refugees, the United States recognized a total of 22,405 people as refugees. Again, while there is great demand by displaced folks, the United States is limiting the amount of refugees it recognizes and asylum applications it approves.
Table 3.1.8 below lists the top five countries that the United States recently recognized the largest amounts of refugees from - with striking annual reductions. Per the U.S. Department of Homeland Security, the biggest declines in refugee recognition tend to be from predominantly Muslim countries.
Table \(\PageIndex{8}\): Selected Characteristics of Refugee Arrivals by Country of Nationality: Fiscal Years 2016 to 2018 (Data from the United States Department of Homeland Security)
Selected Characteristics of Refugee Arrivals by Country of Nationality: Fiscal Years 2016 to 2018
United States Department of Homeland Security. (2013). Yearbook of Immigration Statistics: 2012. Washington, D.C.: U.S. Department of Homeland Security, Office of Immigration Statistics.