
9.4: Financial Market Equilibrium and Interest Rates
- Page ID
- 11840

Now we combine the money supply and the demand for money to show how financial market equilibrium determines nominal interest rates. We have a nominal money supply from the monetary base and the money multiplier from Chapter 8, namely Equation 8.5:
\(M = \displaystyle\frac{(1 + cr)}{(rr + cr)} \times MB\)
The demand for money is a demand for real money balances as determined by real income and interest rates.
\(L = kY - hi\)
The real money supply is simply the nominal money supply M divided by the price level P, M/P, which measures its purchasing power in terms of goods and services.
Real money supply (M/P): the nominal money supply M divided by the price level P.
The central bank, as the source of the monetary base MB, controls the nominal money supply, as long as the currency ratio cr and the reserve ratio rr are constant. In the next chapter we will see how the central bank might manage the monetary base. As long as we keep our assumption that the price level is fixed, the central bank also controls the real money supply. (In later chapters, we allow the price level to change.) Changes in nominal money tend to lead eventually to changes in prices. However, the central bank can still control the real money supply in the short run—it can change M faster than prices P respond—but in the long run other forces determine real money M/P. For the moment, we continue to treat the price level as fixed.
Money Market Equilibrium
Figure 9.2 combines the demand curve for real money balances from Figure 9.1 with the money supply function we saw in Figure 8.2 above into a money market diagram. The demand curve is drawn for a given level of real income, Y0, and the supply curve for a given monetary base MB0. With a given price level, the central bank controls the supply of nominal and real money. The supply curve is vertical at M0/P0. Equilibrium in the money market is at E. At the interest rate i0, the real money balances people wish to hold just equal the money supplied by the central bank and the banking system.
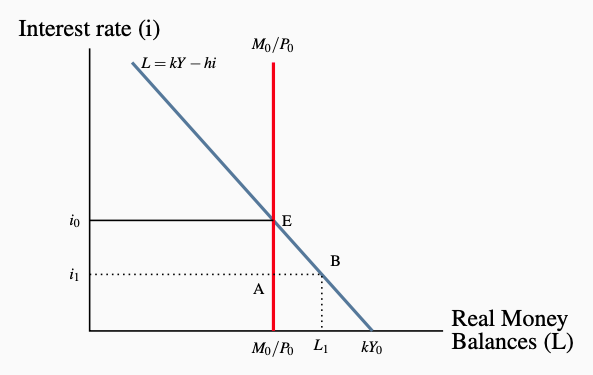
Figure 9.2: Equilibrium in the Money Market
To see how this market operates, suppose the interest rate is i1, lower than the equilibrium level i0. There is excess demand for money in the amount AB in the diagram. People want to hold money balances equal to B at the interest rate i0, but only A is available. How does the market adjust to remove this excess demand? The answer lies in our previous discussion of the portfolio decisions that distribute wealth between money holdings and bonds.
Consider the interaction between the bond and money markets. When portfolio managers want to restructure their holdings of bonds and money they do so by buying or selling bonds on the bond market. Their actions cannot change the supply of money balances. That is fixed by the monetary base and the money supply multiplier. As a result, bond prices and interest rates change to maintain money market equilibrium.
In Figure 9.2 the excess demand for money at the interest rate i1 will result in a rise in interest rates. With an excess demand for money, people sell bonds to adjust their money balances. There is an excess supply of bonds. Bond prices fall. Lower bond prices mean higher bond yields and interest rates, as you will recall from our earlier discussion of asset prices and yields. The higher interest rates reduce both the excess supply of bonds and the excess demand for money. The money market adjusts by moving along the L curve from B to E, as people want smaller money balances relative to their bond holdings at higher interest rates.
From now on, when we discuss adjustments in the money market caused by changes in either the demand for or supply of money balances, those adjustments involve trades in bonds that change bond prices and interest rates to maintain money market equilibrium.
Changes in financial market equilibrium
A shift in either the money supply or money demand changes equilibrium in the money market (and the bond market). Interest rates move to restore equilibrium. Figure 9.3 and 9.4 gives examples.
The effects of a change in the money supply
Suppose the central bank lowers the monetary base and the money supply contracts. For a fixed price level, lower nominal money reduces the real money supply. Figure 9.3 shows this leftward shift in the money supply curve from M0/P0 to M1/P0. The equilibrium interest rate rises from i0 to i1 as people sell bonds. A higher interest rate reduces the quantity of real money balances demanded, moving along the demand curve L(Y0), bringing quantity of balances demanded into line with the reduced supply. Hence, a lower money supply raises equilibrium interest rates. Conversely, a rise in the money supply lowers the equilibrium interest rate.
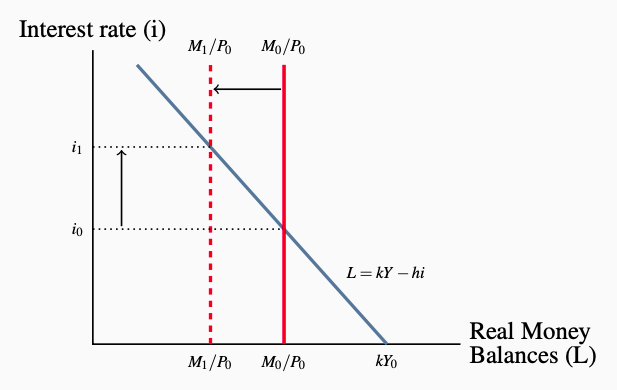
Figure 9.3: Effects of a Fall in the Money Supply
The effect of a change in real income
Figure 9.4 shows real money demand L(Y0) for the real income Y0. A rise in real income increases the quantity of real money balances demanded at each interest rate, shifting the demand for money function from L(Y0) to L(Y1). The equilibrium interest rate rises as portfolio managers sell bonds in an attempt to increase their money holdings. The rise in the interest rate lowers the quantity of real balances demanded, moving along the money demand function L(Y1), and keeps demand for money equal to the unchanged supply. Conversely, a fall in real income would shift the demand for money to the left and reduce the equilibrium interest rate.
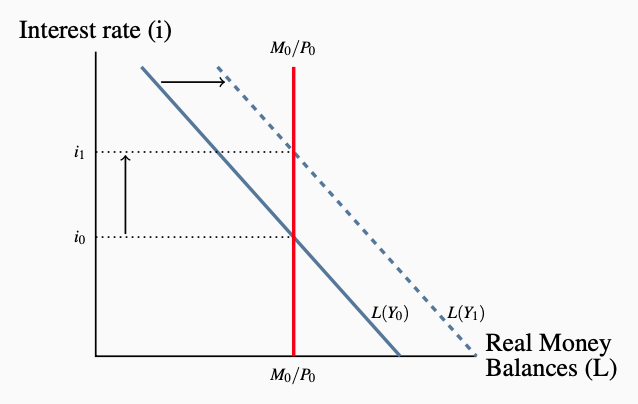
Figure 9.4: Effect of a Rise in Real Income