
Exercises for Chapter 2
- Page ID
- 12726

Exercise 2.1 An examination of a country’s recent international trade flows yields the data in the table below.
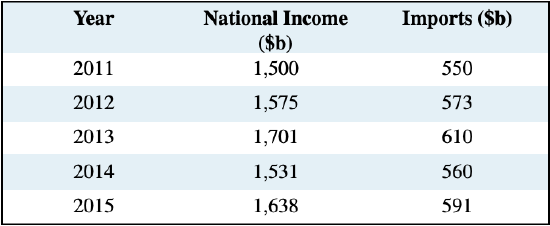
(a) Based on an examination of these data do you think the national income and imports are not related, positively related, or negatively related?
(b) Draw a simple two dimensional line diagram to illustrate your view of the import/income relationship. Measure income on the horizontal axis and imports on the vertical axis.
Exercise 2.2 The average price of a medium coffee at Wakeup Coffee Shop in each of the past ten years is given in the table below.

(a) Construct an annual ‘coffee price index’ for the 2005 time period using 2006 as the base year.
(b) Based on your price index, what was the percentage change in the price of a medium coffee from 2006 to 2013?
(c) Based on your index, what was the average annual percentage change in the price of coffee from 2010 to 2013?
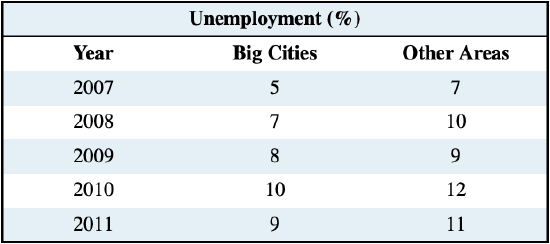
Exercise 2.3 The table below gives unemployment rates for big cities and the rest of the country. Two-thirds of the population lives in the big cities, and one-third in other areas. Construct a national unemployment index, using the year 2000 as the base.
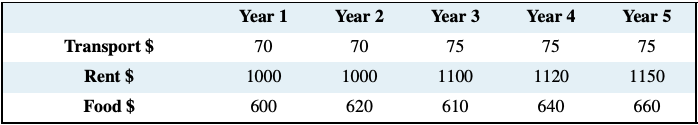
Exercise 2.4 The prices in the following table below are for three components in a typical consumer’s budget: transportation, rent, and food. You must construct an aggregate price index based on these three components on the assumption that rent accounts for 55 percent of the weight in this index, food for 35 percent, and transport for 10 percent. You should start by computing an index for each component, using year 1 as the base period.
Exercise 2.5 The price of carrots per kilogram is given in the table below for several years, as is the corresponding CPI.
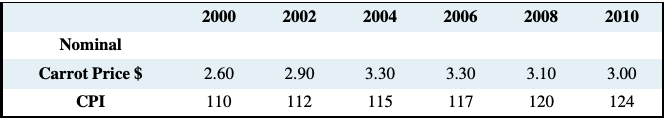
(a) Compute a nominal price index for carrots using 2000 as the base period.
(b) Re-compute the CPI using 2000 as the base year.
(c) Construct a real price index for carrots.
Exercise 2.6 The following table shows hypothetical consumption spending by households and income of households in billions of dollars.
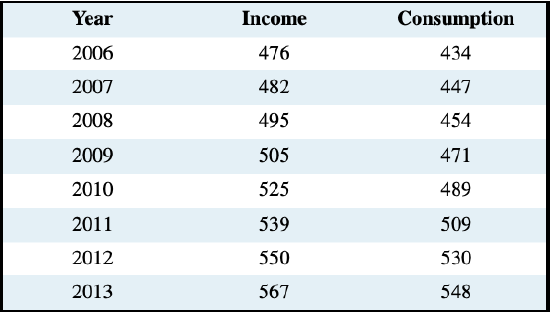
(a) Plot the scatter diagram with consumption on the vertical axis and income on the horizontal axis.
(b) Fit a line through these points.
(c) Does the line indicate that these two variables are related to each other?
(d) How would you describe the causal relationship between income and consumption?
Exercise 2.7 Using the data from Exercise 2.6, compute the percentage change in consumption and the percentage change in income for each pair of adjoining years between 2006 and 2013.
Exercise 2.8 You are told that the relationship between two variables, X and Y, has the form Y = 10 + 2X. By trying different values for X you can obtain the corresponding predicted value for Y (e.g., if X = 3, then Y = 10+2×3 = 16). For values of X between 0 and 12, compute the matching value of Y and plot the scatter diagram.
Exercise 2.9 Perform the same exercise as in Exercise 2.8, but use the formula Y = 10 − 0.5X. What do you notice about the slope of the relationship?
Exercise 2.10 For the data below, plot a scatter diagram with variable Y on the vertical axis and variable X on the horizontal axis.
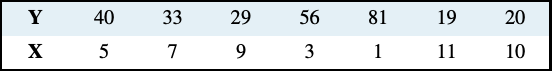
(a) Is the relationship between the variables positive or negative?
(b) Do you think that a linear or non-linear line better describes the relationship?