
1.2: Where on Earth? The Geographic Grid
- Page ID
- 147496
- Define latitude and longitude, and explain how they work as a global coordinate system for absolute and relative location.
- Explain the role of instruments and Indigenous knowledge and tradition in wayfinding.
- Explain how longitude relates to time zones and how latitude relates to seasons and climate zones.
- Identify and describe the general characteristics and latitudinal distribution of the world's major biomes.
The Geographic Coordinate System
Geography’s focus on where requires a system to detect specific positioning in the world. Historically, global positioning was calculated through complicated celestial navigation which dependent upon observing and calculating one’s position relative to the sun, planets, and stars at a given latitude. Today, technological innovations such as satellites and global positioning systems (GPS) enable accurate ‘pinpointing’ of where on Earth selected features are located within the geographic coordinate system, a locational matrix that measures location based on latitude and longitude.
Latitude is an angular measurement north or south of the Equator relative to the center of the Earth. The Equator represents the Earth’s largest circumference and is the line of reference (0 degrees of latitude) for North and South orientation on Earth. A line of latitude, called a parallel, encompasses locations on Earth that are up to 90° degrees North or South of the Equator.
Longitude is the angular measurement east and west of the Prime Meridian, relative to the center of the Earth. The Prime Meridian was determined by international agreement to be in line with the location of the former astronomical observatory at Greenwich, England. Geographers placed this arbitrary line in Great Britain during a time when the British Empire was at the height of its power. This shows how knowledge and science are always shaped by political power. Since the Prime Meridian is the line of reference (0°) for longitude, locations on Earth became East and West relative to Europe. A line of longitude, called a meridian, measures up to 180° East or West of the Prime Meridian.
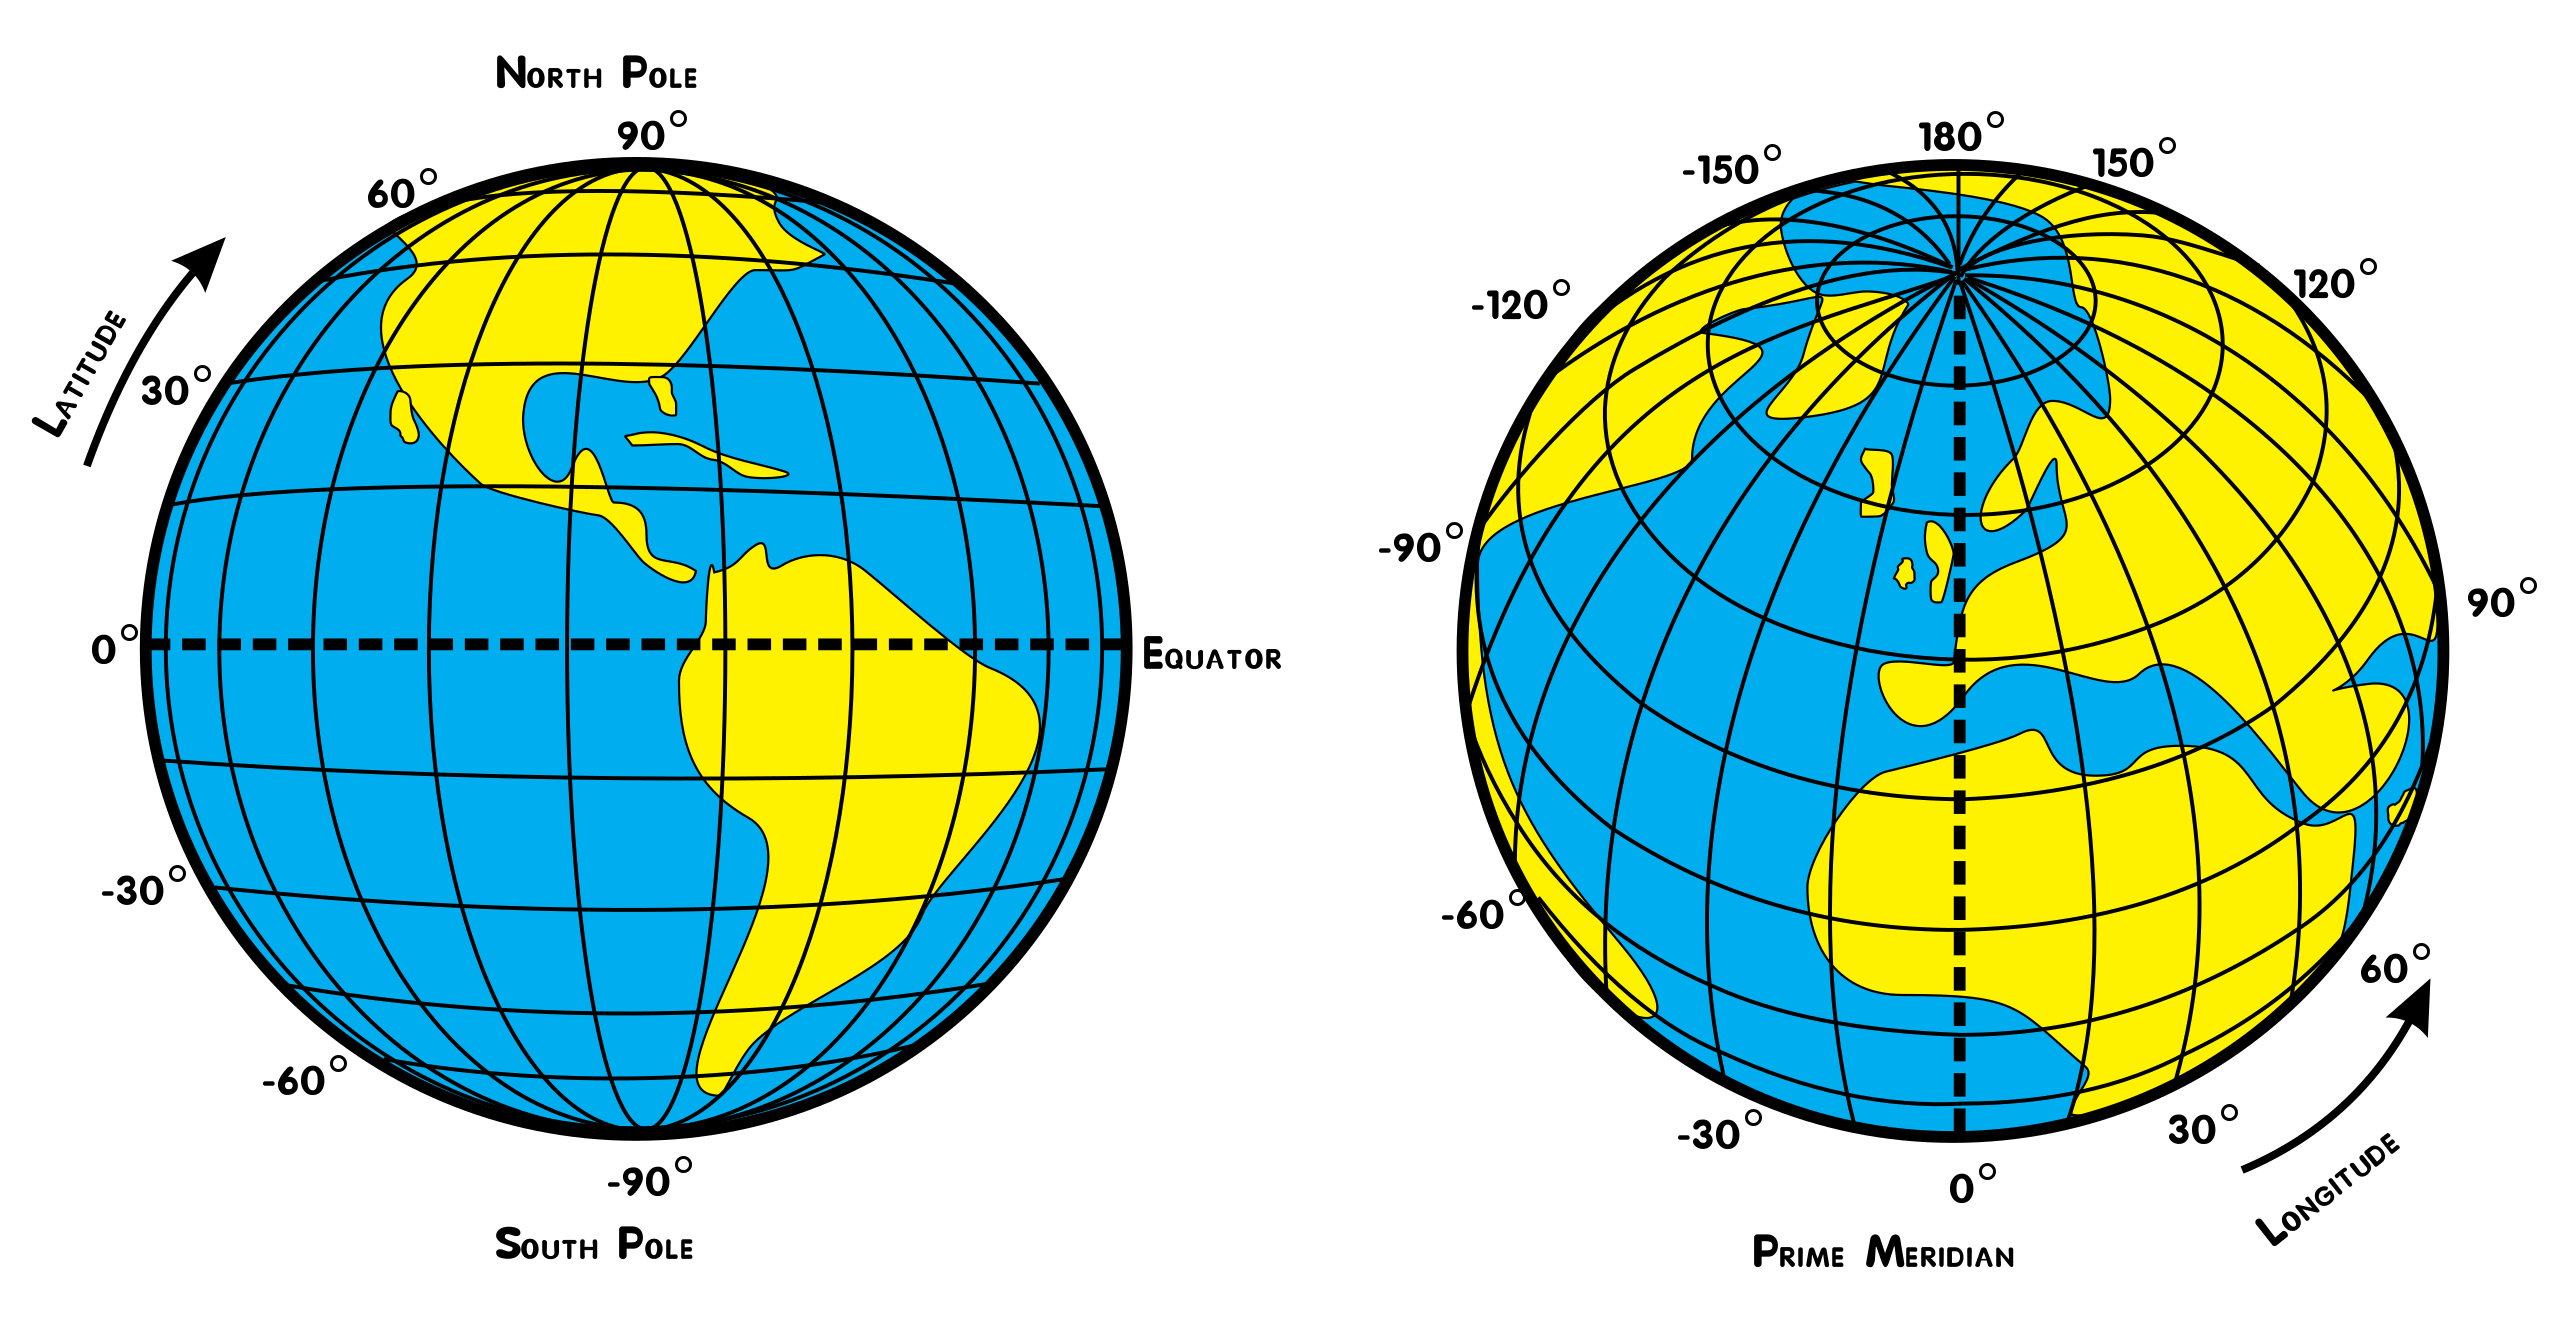
The geographical grid system works as a locational matrix. The intersections of lines of latitude (y) and longitude (x) enable us to determine absolute locations, or a numerical address on Earth (the coordinates are symbolized as first latitude then longitude. Example: 33°N, 118°W). The geographical grid also establishes a conceptualization of relative location, or the location of places relative to other places, as it identifies continents and peoples East or West or North and South relative to the grid’s imaginary center. Based on this system, all locations on Earth are relative to the central point (0°,0°) of the coordinate system, the point where the Prime Meridian and the Equator intersect. This point is named Null Island, a humorous reference to the fact that no island exists here. The location is marked by a weather buoy located in the international waters of the Atlantic Ocean, in the Gulf of Guinea in West Africa. Yes, everything on Earth is measured in absolute terms (latitude and longitude coordinates) and relative terms (east/west, north/south) in reference to an imaginary center marked by a buoy.
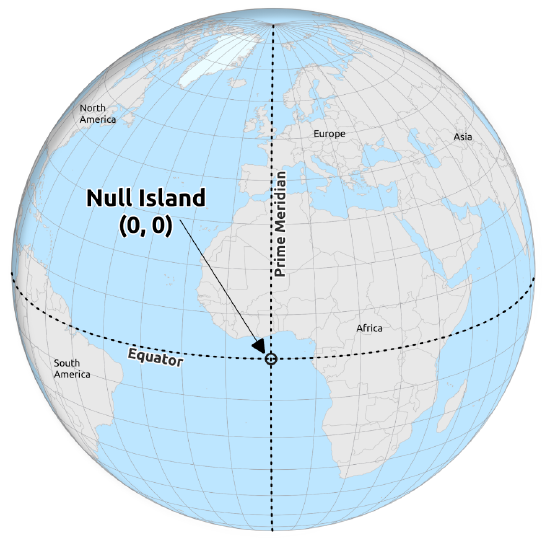
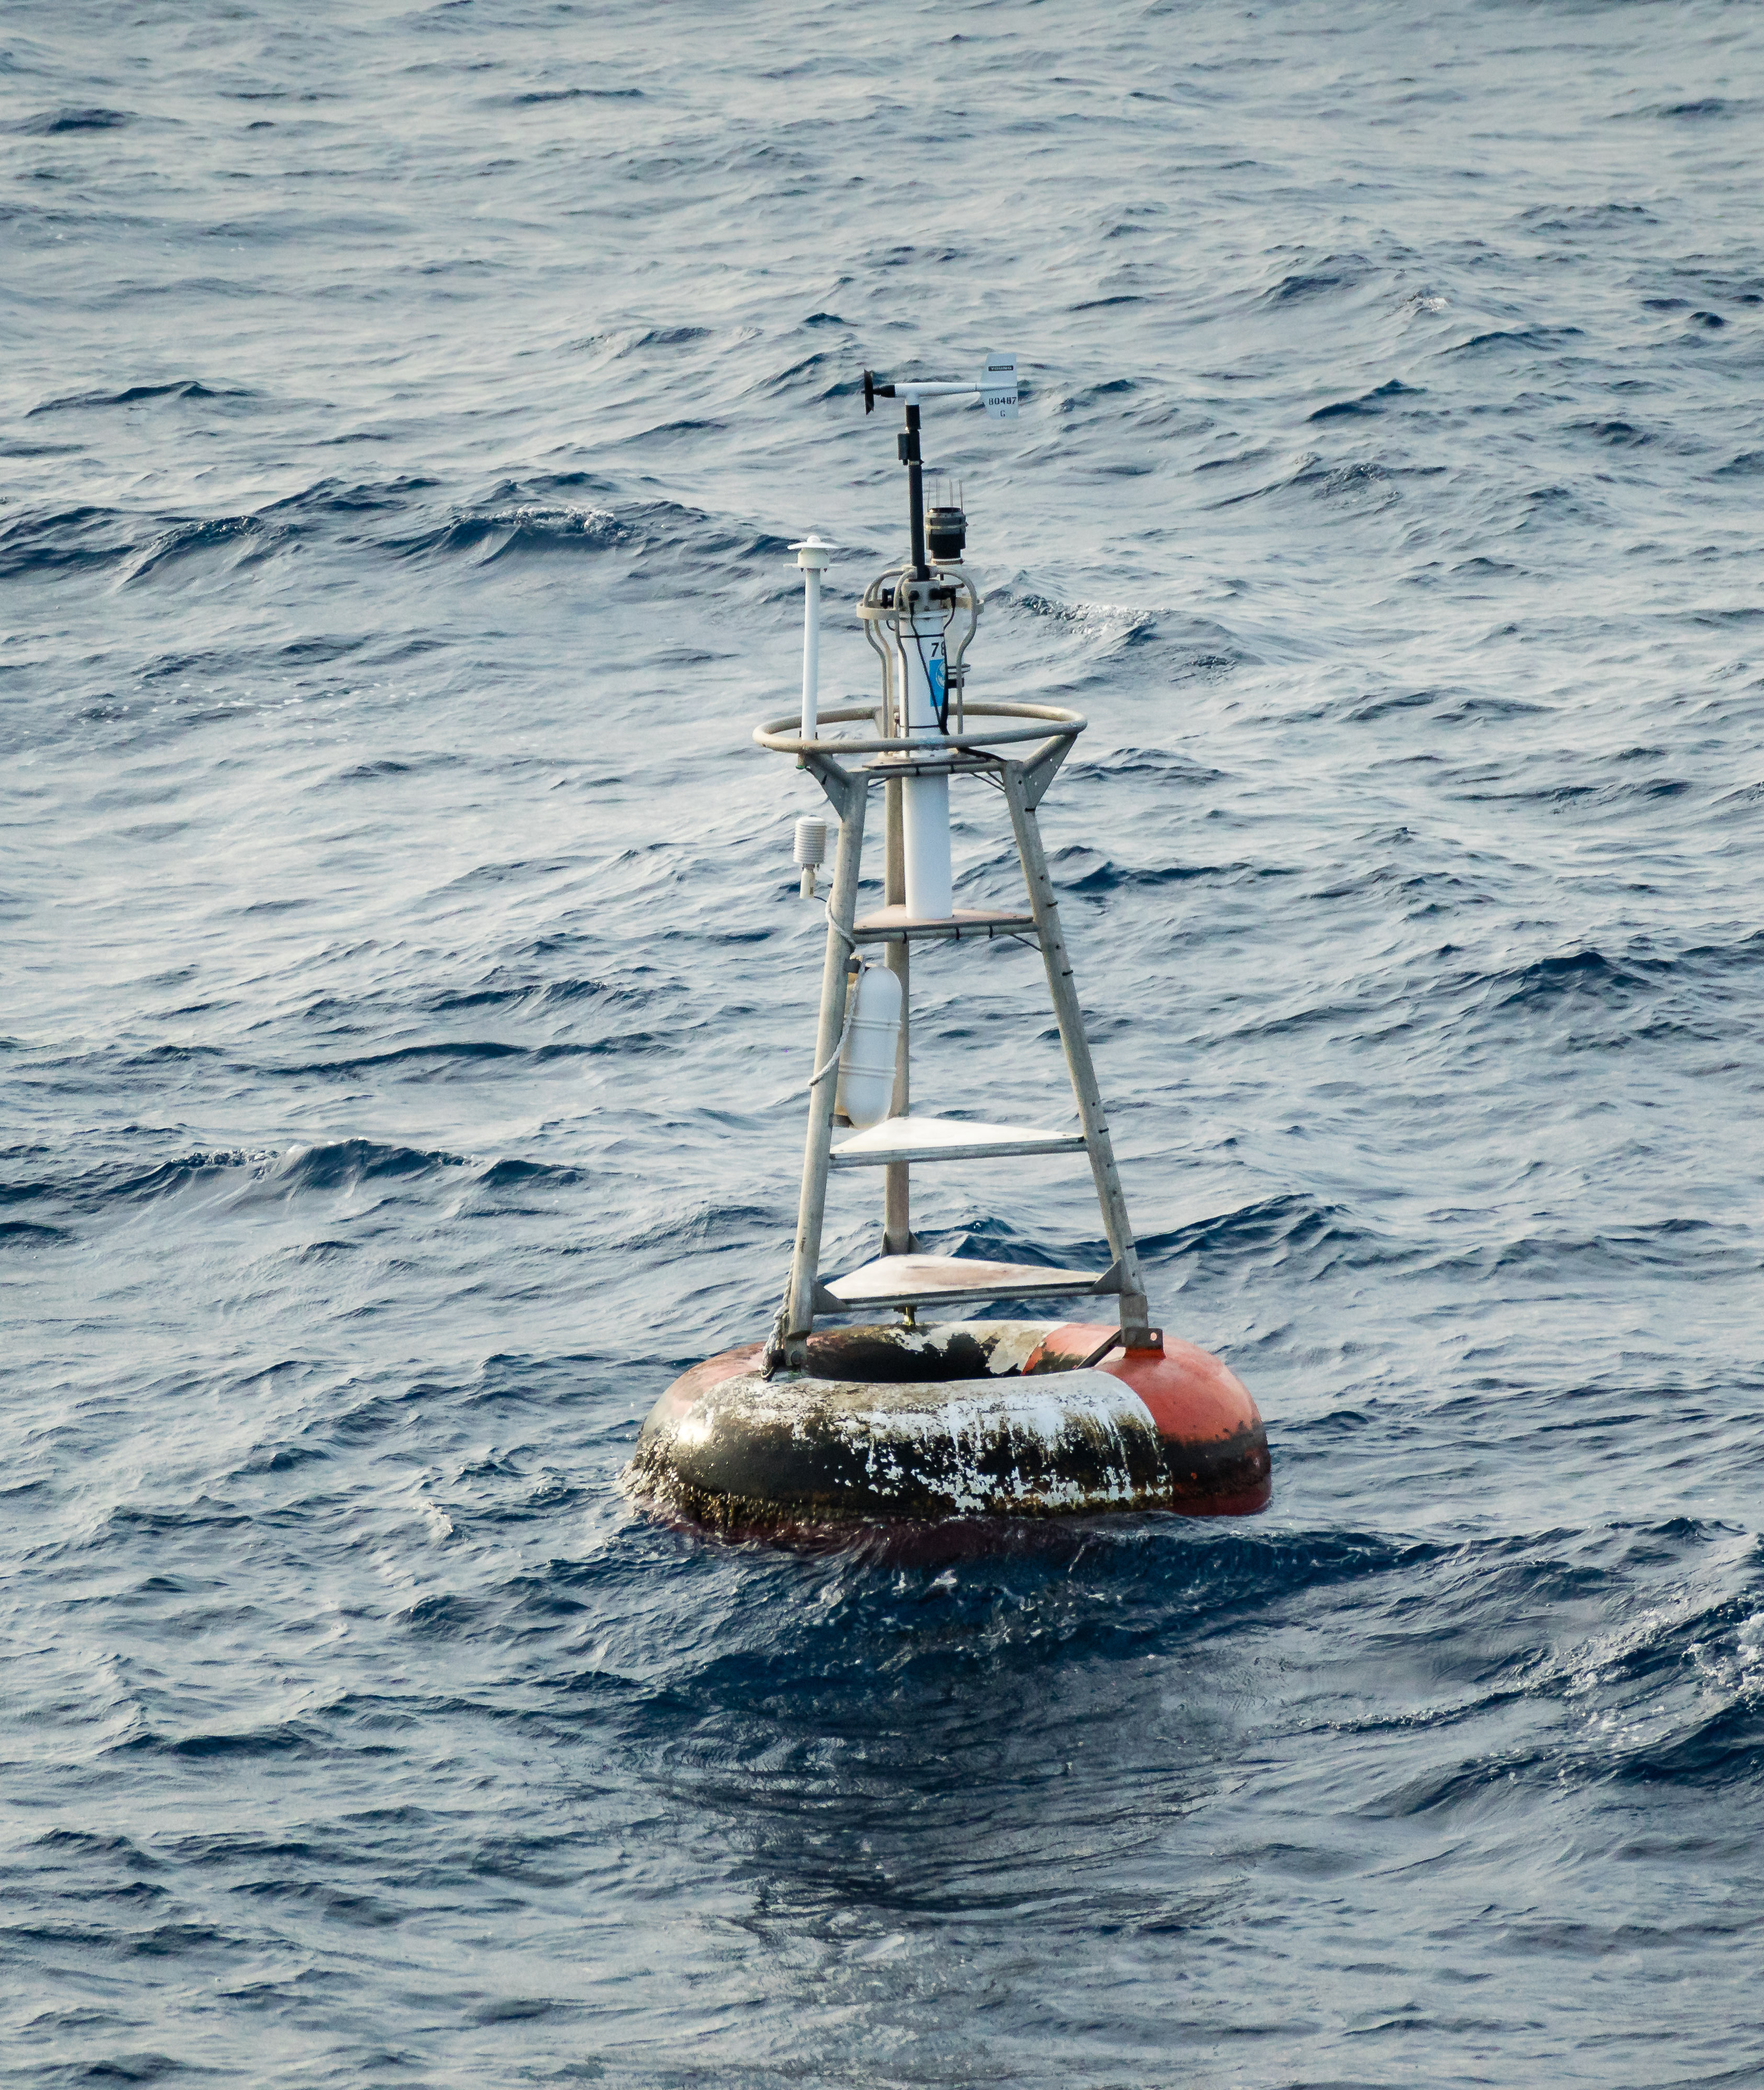
Figure \(\PageIndex{2}\): [left] This figure shows the location of Null Island, a fictional place, at the intersection of the Equator and Prime Meridian, with geographic coordinates of (0°, 0°). (CC BY-SA 4.0; Levente Juahaz via Wikimedia Commons). [right] This picture depicts the National Data Buoy Station 13010 (0°, 0°) maintained by the Prediction Research Moored Array in the Atlantic (PIRATE), anchored off the coast of Guinea. (CC BY-SA 4.0; Graham Curran via Wikimedia Commons).
Wayfinding: the stars, the chronometer, and GPS
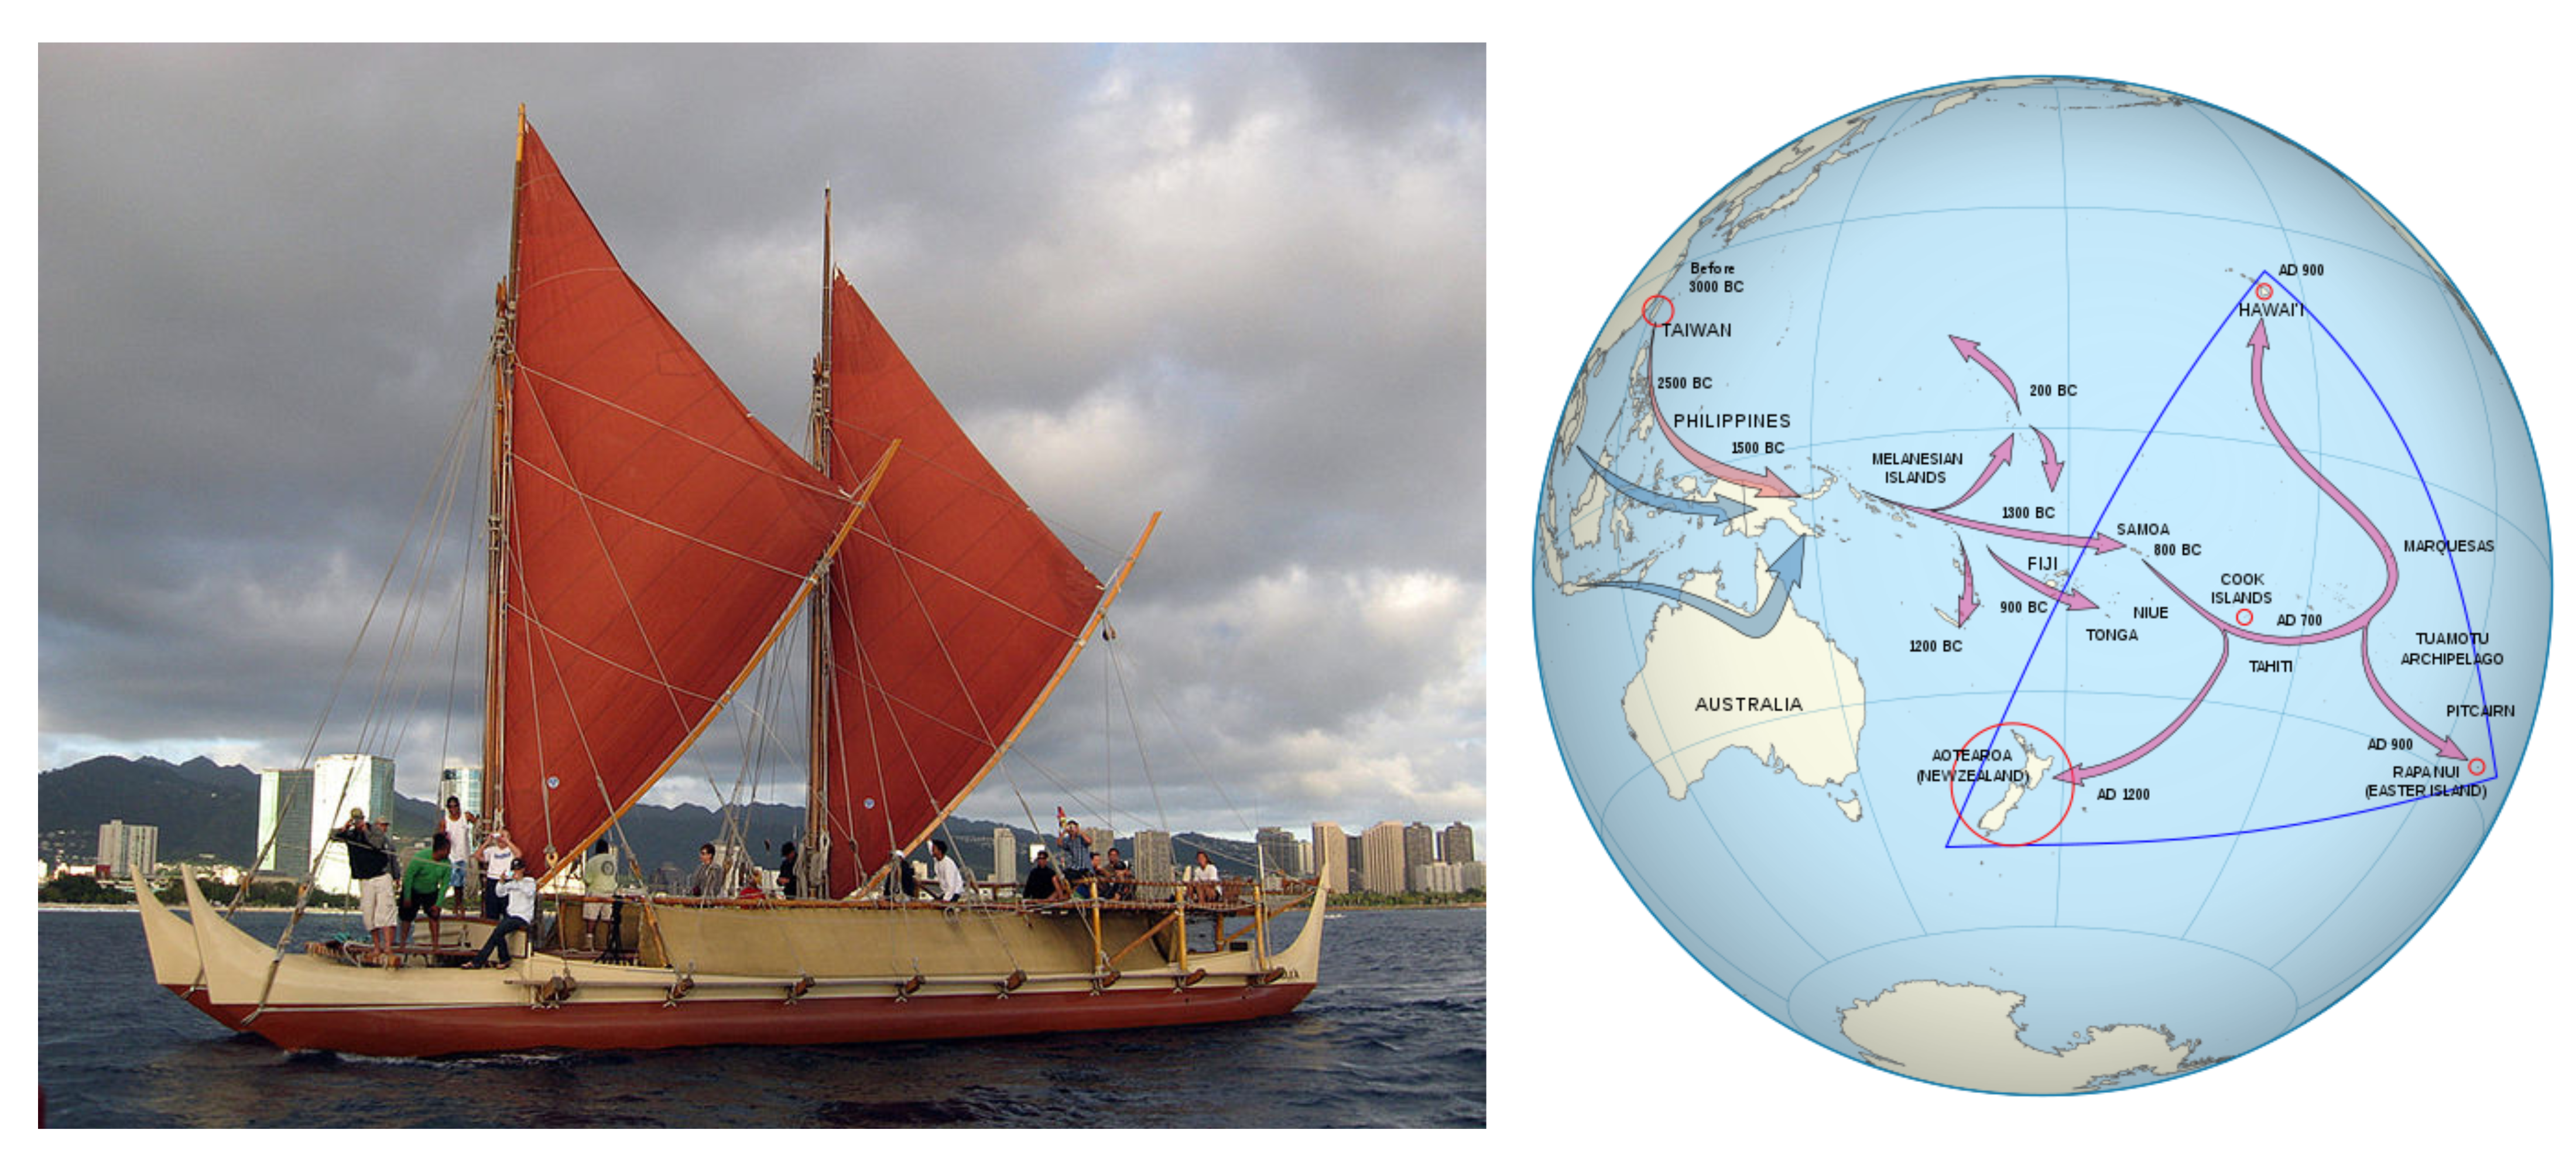
Humans have a long history of wayfinding, figuring out ways to journey across oceans and deserts and to settle in new places. Polynesian navigators provide a telling example of this legacy, based on their vast expansion across the Pacific Ocean. Over thousands of years, Polynesians have navigated an oceanic expanse equivalent to twice the size of Canada - without instruments.[1] Their ventures were guided by their expert knowledge of oceanic currents, winds, and especially the stars. For thousands of years Polynesian navigators have collaborated to develop a mental compass based on a sophisticated understanding of the movement of stars and their constellations through the night sky. A rising star cuts the horizon at a low point but can only be used as a positioning reference for a certain time before it has risen too high, and the next star to rise is then used to keep the craft on course. By day or when the night was cloudy, Polynesians steered their canoes by reading ocean currents and winds. Throughout the Pacific, island navigators used a rich oral tradition to pass down their sea faring knowledge from one generation to the next[2]
The Polynesian mastery of the seas became an enigma for Europeans who encountered the Pacific Islands in the 16th Century. Europeans puzzled over Polynesian knowledge and wondered how they came to inhabit such vast expanse in the Pacific Ocean without any navigational instruments, not even a compass. At a time when Polynesians had already sailed more distance than any other known civilization, European sailors feared the open sea, keeping their journeys within proximity of coastlines. For thousands of years, navigators have struggled to learn a frame of reference to sufficiently guide long-distance travel into featureless terrain such as the open ocean. Over the centuries, increasingly sophisticated devices were used to measure the height of the sun and stars above the horizon to measure latitude.
Figuring out longitude remained a problem for navigators for centuries. Columbus reached the Americas without having an accurate and reliable method or device to calculate how far west he had sailed into the Atlantic Ocean. Great minds had tried for centuries to develop a method of determining longitude, to accurately position travelers as they journeyed east and west. Hipparchus, a Greek astronomer (190–120 BC), proposed that longitude be determined by finding the difference between an absolute time and local time. However, his method required an accurate clock, something yet to be invented. It was not until centuries later that this would be solved, motivated by an act of the British Parliament in 1714 that offered financial reward to anyone who would solve the longitude problem. Amateur clock maker, John Harrison, saw time as the key and realized that if you could determine local time (from the position of the sun) and the time at some reference point (like Greenwich), you could calculate the time difference between the two and work out how far apart the two places were in terms of longitude. In 1730, he produced his first design of a marine chronometer. Harrison’s solution revolutionized navigation for hundreds of years until the development of Global Positioning Systems (GPS) improved our ability to locate points on the Earth through a constellation of satellites and ground stations. They are like artificial stars used as reference points to calculate a terrestrial position within an accuracy of a few meters.
Instruments have undoubtedly revolutionized navigation, but scholars for far too long have attributed navigational capabilities to technological development. During the centuries of the European colonial empire, the Polynesian mastery in navigation was largely dismissed because of the lack of technological instruments. Early academic theories denied the seafaring expertise of the Polynesians, hypothesizing that they had come to inhabit a wide expanse of the Pacific by accidentally drifting from island to island. Scholars now widely recognize that Polynesians settled these islands over thousands of years based on ancestral navigational techniques rooted in their rich knowledge of the natural world. Over time, much of this knowledge was lost due to colonization and the influx of navigational technology. Seeking to revive and reaffirm a seafaring tradition, the Polynesian Voyaging Society (PVS) was founded in 1973. They sought to recover the little knowledge that was left, from the very few Polynesian navigation masters that still lived, to counter the hypothesis of “accidental drift” by reenacting navigation based entirely on Indigenous knowledge of the sun, stars, ocean currents, and the winds. Their inaugural sail in 1976 was completed on a newly crafted Hōkūle'a, a Polynesian voyaging canoe, taking 33 days to sail from Hawaii to Tahiti with only traditional knowledge. Over the course of fifty years, the PVS has trained thousands new navigators, including women who had traditionally been excluded.[3] PVS expeditions symbolize a renaissance of traditional Polynesian wayfinding, a reclamation of culture and history. Hōkūle'a voyages brought much pride to the Pacific Islands, reasserting that Polynesian wayfinding belongs not merely in museums, but in the ancient star-lit tracks drawn in the mental maps of master navigators who are reviving and passing their ancestral knowledge to many generations to come.
Longitude and Time Zones
The quantification of time is essentially the counting of how many times the Earth rotates on its axis and revolves around the sun. It is a helpful social construct that relates the world to a central clock in Greenwich, London (where the Prime Meridian is referenced). The Earth rotates on its axis 15 degrees every hour. Time zones are established roughly every 15 degrees longitude so that local times correspond to similar hours of day and night. With this system, the sun is generally overhead at noon in every time zone that follows the 15-degree-wide system. Every fifteen degrees of longitude west of the Prime Meridian is one hour earlier, and every fifteen degrees east of the Prime Meridian is one hour later.
The Universal Time (UT), Coordinated Universal Time (UTC), Greenwich Mean Time (GMT), or Zulu Time (Z): all four terms can be defined as local time at 0 degrees longitude, which is the Prime Meridian. This is the same time under which many military operations, international radio broadcasts, and air traffic control systems operate worldwide. UTC is set in zero- to twenty-four-hour time periods, as opposed to two twelve-hour time periods (a.m. and p.m.). The designations of a.m. and p.m. are relative to the central meridian: a.m. refers to ante meridiem, or “before noon,” and p.m. refers to post meridiem, or “after noon.” UT, UTC, GMT, and Z all refer to the same twenty-four-hour time system that assists in unifying a common time in regard to global operations. For example, all air flights use the twenty-four-hour time system so the pilots can coordinate flights across time zones and around the world.

The 15-degree time zones are not uniform and do not necessarily follow state, regional, or local boundaries. Time zones are seldom exactly 15 degrees wide and usually have varied boundary lines. In the United States, the boundaries between the different time zones are inconsistent with the lines of longitude; in some cases, time zones zigzag to follow state lines or to keep cities within a single time zone. Other countries address the problem differently. China, for example, is as large in land area as the United States yet operates on only one time zone for the entire country. Ultimately, time as we know it is imaginary and constructed. The progression of life, aging and decaying, certainly materialize the notion of a temporal element to physical existence on Earth. However, the quantification of time is a social construct – countries decide what time zone they wish to follow.
Latitude, Seasons, and Global Climates
Latitude, solar radiation, and seasons
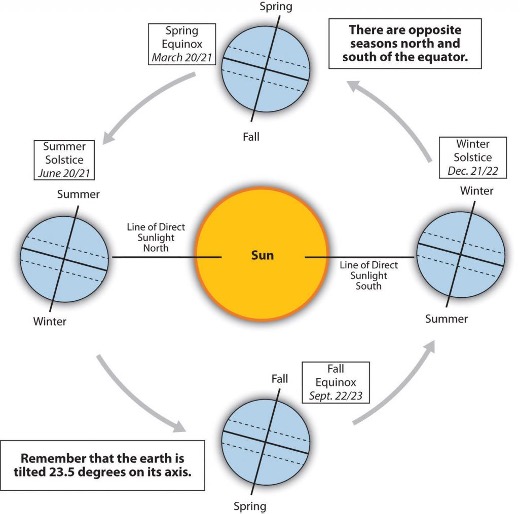
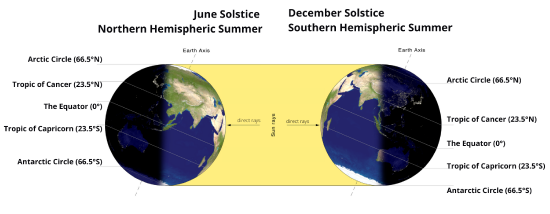
Where we are north or south of the equator is particularly important because of the Earth’s relationship to the sun. The earth is tilted on its axis 23.5 degrees. As it rotates around the sun, the tilt of the earth’s axis exposes the northern and southern hemispheres to direct solar radiation during their respective Summer Solstice. The northern hemispheric summer occurs when direct solar radiation reaches its northernmost latitude, the Tropic of Cancer (23.5°N). Likewise, the southern hemispheric summer occurs when direct solar radiation reaches its southernmost latitude, the Tropic of Capricorn (23.5°S). Thus, the rotation of a tilted Earth around the sun results in an uneven and shifting distribution of direct solar radiation. Because direct solar radiation shifts between the Tropic of Cancer and Tropic of Capricorn throughout the year, there is a warm region in between these parallels known as the tropics. This area does not experience dramatic seasonal changes because the amount of direct sunlight received does not vary widely. The higher latitudes (north of the Tropic of Cancer and south of the Tropic of Capricorn) receive more diffused solar radiation, are colder, and experience significant seasonal variations in their climates.
High latitudes are also susceptible to greater variations in daylength. Because the tilt of the earth, hemispheres are tilted either towards or away from the sun during the Solstices, exposing extreme latitudes to greater hours in light or darkness (see Figure#). This is true in the North Pole (90°N), the northernmost latitude or the South Pole (90°S), the southernmost latitude. Both points are the places are associated with frigid climates and lengthy days and nights during the solstices. This susceptibility to great variations in daylength extends to lower polar latitudes. The Arctic Circle (66.5°N) is the northernmost parallel to experience daytime in the northern hemisphere’s winter (December). The Antarctic Circle (66.5°S) is the southernmost parallel to experience daytime in the southern hemisphere’s winter (July). In other words, the Artic and Antarctic Circles mark northern and southern latitudes and are susceptible to 24-hour days and 24-hour nights. North of the Arctic Circle, the sun is above the horizon (during the summer) for twenty-four continuous hours at least once per year. It is then below the horizon (during the winter) for twenty-four continuous hours at least once per year. Latitudes south of the Antarctic Circle experience the same patterns of polar days/nights respective to the hemispheric season. This wide variation in daylength is paused during the Equinoxes, when no hemisphere is tilted towards or away from the sun and all latitudes experience 12 hours of day and night.
Latitude, climates, and biomes
The variations in solar radiation relative to the Earth’s tilt means that global climates are also shaped by latitude. Falling between the Tropic of Cancer (23.5°N) and the Tropic of Capricorn (23.5°S), the tropics receive the most direct solar radiation throughout the year, which creates cloud formations around this equatorial region. The intense sun over tropical landmasses and oceans results in a rising and moist airmass, making it the world’s warmest and wettest climate region. The [Ww4] sub-tropics are a transitional zone within a few degrees of the tropics and the mid-latitudes (also called temperate zones), extending roughly 30-60° in the Northern and Southern hemispheres. The transition between temperate and polar zones are often referred to as subpolar regions, while the Antarctic (66.5°S) and Arctic Circles (66.5°N) delineate polar latitudes.
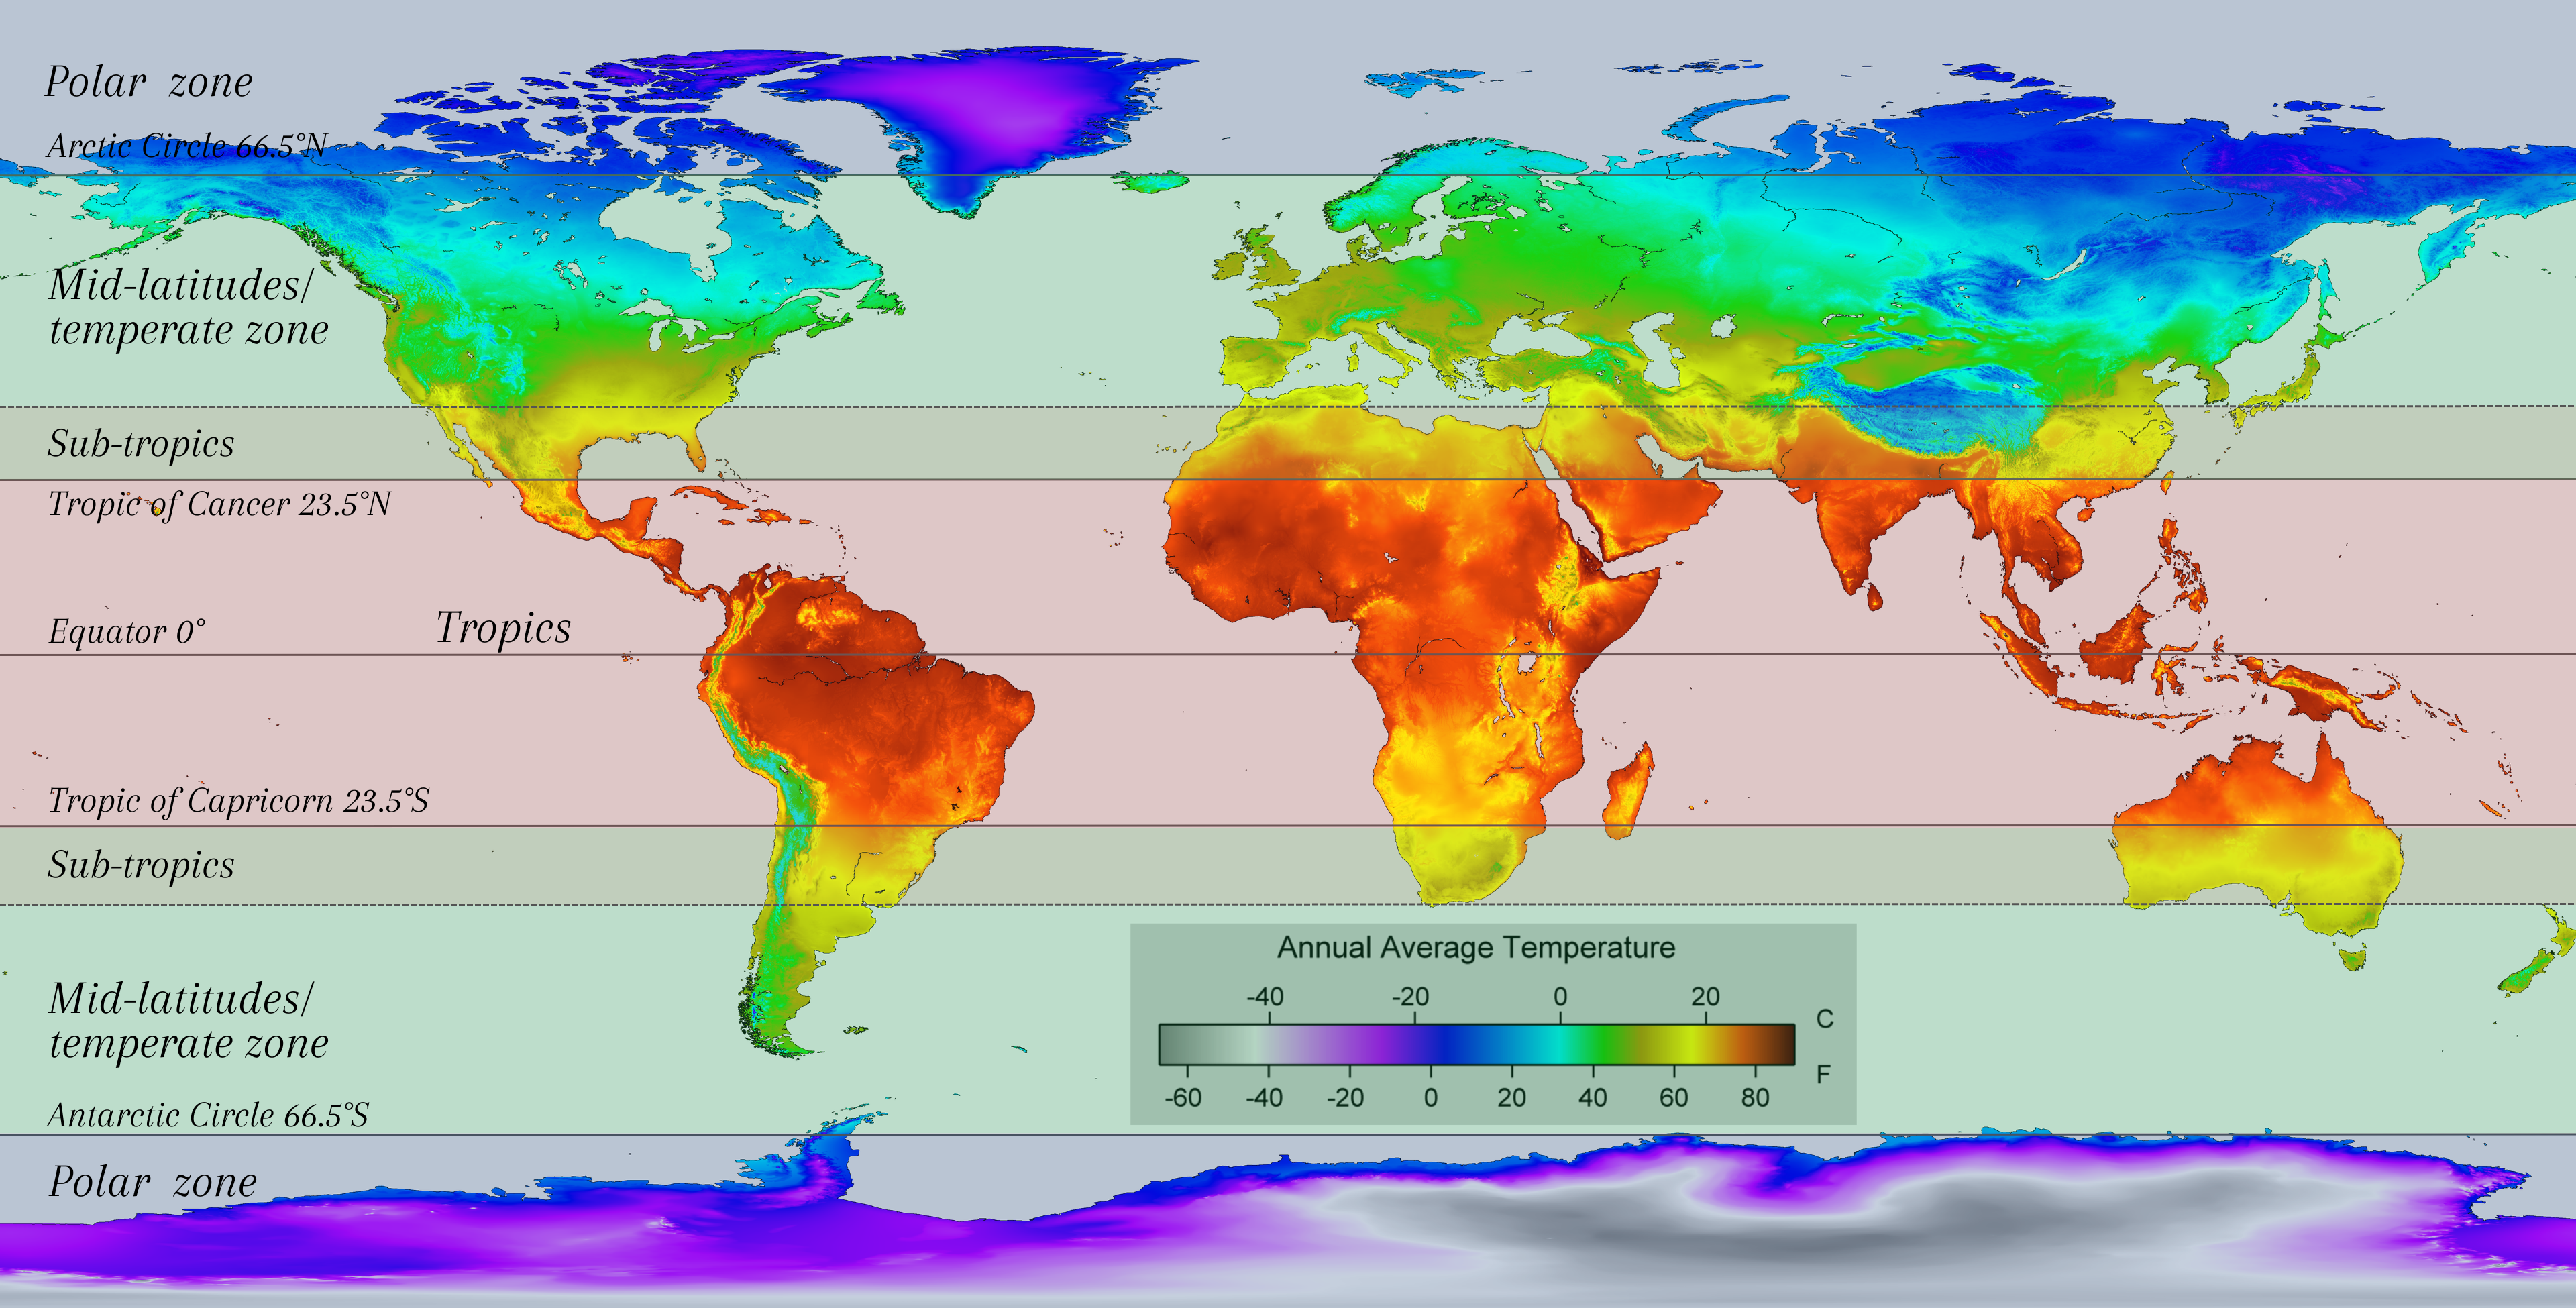
Geographers use a diverse variety of data, collected over multiple decades and even millennia, to better understand climate, or the long-term patterns of weather, along these latitudinal regions. A climate zone results from an area’s temperature, humidity, amount and type of precipitation, and seasonality. These factors are largely attributed to latitude but also vary according to ocean currents, air circulation patterns, and the location and size of landmasses. In general, climate zones remain roughly the same across similar latitudes and in similar positions on nearly all continents, both in the Northern and Southern Hemispheres. The one exception to this pattern is the continental climates, which are not found at higher latitudes in the Southern Hemisphere. This is because, as landmasses extend into the Southern Hemisphere, they become too narrow to generate a continental climate.
The most common system used to classify climatic zones is the Köppen classification system. This system is based on the temperature, amount of precipitation, and the time of the year when precipitation occurs. The Köppen classification system recognizes four major climate groups based on temperature values (identified by the capital letters A, C, D, and E), and the fifth based on moisture (identified by the capital letter B), to describe global climate patterns. The major climate groups can then be subdivided into more specific categories based on a combination of temperature and moisture patterns for any region in the world. The Köppen classification system in wide use today includes several modifications by geographers and other climatologists. The modified version maintains the five major climate categories, now broken down into fourteen subcategories. The modified version also has a new category for “highland,” represented with the capital letter H, and focused on mountainous regions.
The Köppen classification system is widely used in geography, and it is particularly helpful in understanding the nuances of temperature and precipitation patterns that exist within moist, arid, temperate, coastal, and polar climate types. Throughout this book, however, we will approach the world’s environments in a broader sense. Since climate determines the type of vegetation that grows in an area, vegetation is often used as an indicator of climate type. A climate type and its plants and animals make up a biome, or a natural life region. Biomes are typically distinguished by the characteristics of their vegetation (which makes up the largest portion of an area’s biomass). The organisms of a biome share specific characteristics worldwide because their environment offers similar advantages and challenges, so they have adapted to that environment in similar ways over time. For example, distinct cactus species live on different continents, but they have adapted to the deserts and other arid environments in similar ways. Biomes can be a useful way of making sense of similarities across world regions. It is important to remember, however, that they represent broad categories. Each biome can be understood through various sub-types that occur in unique geographical contexts, some of which we will explore in each regional chapter.
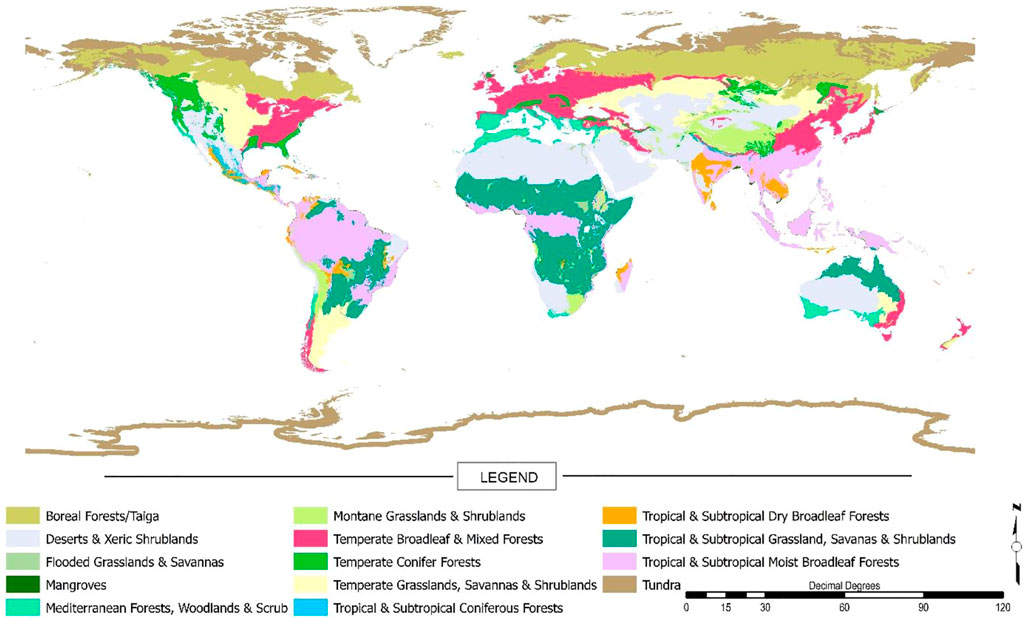
Table 1.2.1: World Wildlife Fund Biome Descriptions and Geographic Distributions
| Biome Scientific Name (World Wildlife Fund) | Biome Simplified Names and Descriptions[4] | Geographic Distribution (see map) |
|---|---|---|
| Tropical and sub-tropical moist broadleaf forests | Tropical rainforests are biomes that experience warm temperatures year-round, with abundant rain, approximately 80 inches of rain per year. Relative climate stability is a key characteristic, and temperature is around 78°F all year. Where climate variability exists, seasons are marked by rainy and dry seasons. Tropical rainforests are dominated by evergreen and deciduous trees with large leaves that form multilayer forests. Shade-tolerant plants exist at lower layers and trees filled with life form the forest canopy. Trees cope with nutrient-poor and acidic soils, featuring shallow roots and large dark green leaves. Other plants like orchids, bromeliads, vines (lianas), mosses, palms, and ferns are common. This is the terrestrial biome with highest species diversity. | Tropical and subtropical. Tropical rainforests form discontinuous patches along a global equatorial belt between 15-25 degrees north and south of the equator. The largest tracts are found in Amazon in South America, Central Africa, and Southeast Asia. Other coastal rainforests exist in eastern Middle and South America, in South Asia, and in the East Arc in Africa and in Madagascar. |
| Tropical and subtropical dry broadleaf forests | Tropical dry forests are biomes that mirror the patterns of rainforests, receiving abundant precipitation, but with a pronounced dry season. The forest canopy is not dominated by evergreen trees but by deciduous trees. | Tropical and subtropical. Prominent examples of tropical dry forests are most prominent in India, Madagascar, Bolivia, Mexico, and Southeast Asia. |
| Tropical and subtropical coniferous forests | Tropical coniferous forests experience low precipitation and moderate temperature variability. They showcase diverse species of conifers and a thick closed canopy that allow very little sunlight to penetrate lower forest level, so there is little underbrush. Fungi and ferns thrive in the forest floor. | Tropical and subtropical. These coniferous forests are found in the Americas, from Nicaragua to the Greater Antilles. Mexico harbors the world's richest subtropical coniferous forest. Other tracts can also be found near the Himalayas in Asia. |
| Tropical and subtropical grasslands, savannas and shrublands | Tropical savannas are tropical biomes that experience warm or hot climates receiving 20-50 inches of rain annually. This rain falls over six-eight months of the year, followed by a long period of drought. Grasses and sparse trees are the predominant vegetation. They are well adapted to the extended droughts as well as periodic fires. Herbivores and iconic large mammals are abundant. Reliant on abundant grasses, they follow the rains and migrate extensive areas. Predators are also abundant due to the many herbivores. | Tropical and subtropical. Africa has the world's most extensive savannas outlining north and south of the Congo Basin, but vast savannas also exist in South America and Australia. |
| Flooded grasslands and savannas | Also referred to as wetlands, flooded savannas are areas where water frequently saturates the soil and become flooded either all year long or seasonally. They support a large diversity of plants and animals and support migratory species of waterbirds and mammals. | Tropical and subtropical. Flooded savannas exist along rivers and river deltas. The most prominent examples include the Okavango Delta in Botswana, the Pantanal in Brazil, and the Everglades in the US, Florida. |
| Deserts and xeric shrublands | Deserts are found in arid regions that experience dry climate conditions, receiving less than 10 inches of rain annually. The evaporation rates exceed rainfall, so deserts experience a moisture deficit. Desert regions tend to have abundant sunshine, hot summers, cold winters, and irregular rains. Droughts are frequent, which can last several years or even decades. There are also great temperature variations by day and night and from summer to winter due to lack of plants and global distribution. Deserts are home to specialized vegetation and animals that are well adapted to dry conditions. Deserts can be categorized as semi-arid, coastal, hot and dry, and cold. | Mid-latitude/temperate. The world's largest desert is the Sahara Desert, in Africa. Other deserts span across the continents around the mid-latitudes, including the southwest of the United States, Mexico, the Arabian Peninsula, South Africa, and Australia. Deserts also occur in tropical regions due to ocean currents and the rainshadow effect (explained in future chapters). |
| Mediterranean forests, woodlands, and scrubs | Mediterranean biomes are regions that experience unique coastal climates. Because of their relative location near the subtropical high-pressure zones, these climates tend to have plenty of sunshine during the summer. Most of their annual precipitation occurs during the winter months with totals of 30 to 90 cm (14 to 35 inches) and hot and dry summer months. Plants like hardy shrubs and trees are adapted to hot and dry summer conditions and many plant species are fire-dependent | Mid-latitude/coastal. Mediterranean woodlands and shrubs exist in the mid-latitudes between 30-45 degrees north and south of the equator. Prominent examples can be found in Mediterranean Europe, South Africa, Central Chile and Australia. |
| Temperate grasslands, savannas and shrublands | Temperate grasslands differ from tropical savannas by having greater temperature variations from summer to winter, having hot summers (sometimes over 100F) and cold winters (sometimes below freezing). They also receive less precipitation (20-30 inches), usually in the late spring and early summer. This biome is dominated by grasses and large trees and shrubs are absent. The height of grasses varies by rain, with taller grasses being dominant in places of greater rainfall. Temperate grasslands have among the most fertile soils. Globally, they have been largely converted into farms or rangelands. | Mid-latitude/temperate. |
| Temperate Broadleaf and Mixed Forests | Temperate deciduous forests experience a wide variability in temperature and precipitation. Hot summers (86°F) and cold winters (-22°F) are typical in this biome, with an average annual temperature of 50°F and 30 to 59 inches of rain per year. Temperate deciduous forests are most notable because they go through four seasons: Winter, Spring, Summer, and Fall. Leaves change color in autumn, fall off in the winter, and grow back in the spring. This adaptation allows plants to survive cold winters. These forests feature broadleaf trees like oaks, maples, cottonwoods, and beeches, and shrubs, perennial herbs, and mosses. The forest canopy is somewhat dense but allows light to penetrate and providing for a rich and diverse understory. | Temperate |
| Temperate Coniferous Forest | The temperate coniferous forests are evergreen forests that experience warm summers and cool winters. They are common in coastal areas with mild winters and heavy rainfalls. This is a contrasting characteristic from the colder taiga/boreal forests of the north and the greater temperature variability of the temperate deciduous forests. Many species of trees inhabit this biome including the pine, cedar, fir, and coastal redwood. The forests often have overstory and understory, sometimes supporting a layer of shrubs or grasses that fuel ecologically important wildfires. | Temperate |
| Boreal forests/Taiga | The taiga/boreal forest is the largest terrestrial biome, occurring in vast swaths of land in the northern latitudes. They are dominated by continental polar air over frigid continents that experience very low temperatures, well below freezing during the winter. Snowfall is light (about 20 inches per year), but cold temperatures keep snow on the ground for months. There is low biodiversity. Nutrient poor soils and permafrost favor cold-tolerant coniferous trees like pine, fir, and spruce. | Polar/Montane |
| Montane grasslands and shrublands | Highland biomes are found at the higher altitudes of the world’s mountains, resembling climates and biomes of higher latitudes. Many mountains are high enough to experience polar conditions along its peaks. Mountain biomes experience differential conditions depending on the altitude, slope, aspect, and situation relative to local wind patterns. Highlands have complex climates and a variation of tropical, subtropical, and temperate life forms at different elevation zones. These are often described as montane grasses or shrubs. Highlands are also characterized by high levels of endemism, of life forms that only exist in within their geographical extent. | Polar/Montane |
| Tundra | The tundra is polar biome with average winter temperatures of about -30°F, and the average summer temperature 37-54°F. Temperatures in tundra climates are so cold that a layer of permanently frozen ground, called permafrost, can extend hundreds of feet below the surface. The average temperature of the warmest months is above freezing, so summer temperatures defrost the uppermost part of the permafrost, sometimes causing soggy conditions. Although the precipitation is low (less than 10 inches), evaporation rates are also low, so the landscape receives more usable water than a desert. This cold environment poses great challenges for sustaining life, and the tundra is marked by low biodiversity. Nonetheless, there are many unique organisms that inhabit the tundra like low shrubs, sedges, reindeer mosses, and grasses. | Polar/Montane |
| Mangroves | Mangroves are biomes of tropical and subtropical coastlines that act as a buffer zone between land and sea. Mangrove forests are typically made up of trees and shrubs that have unique adaptations to cope with the harsh conditions of high salinity, warm air and water temperatures, extreme tides, muddy waters, and oxygen-depleted soils. Mangroves are among the most biologically important ecosystems on the planet, home to many unique flora and fauna. They are a powerful natural barrier that serves as a first line of defense against hurricanes by dissipating wave and wind energy and reducing erosion. | Coastal areas |
References:
[1] Davis, W. (2009). The wayfinders: Why ancient wisdom matters in the modern world. House of Anansi. Pp 35-78.
[2] Davis, W. (2009). The wayfinders: Why ancient wisdom matters in the modern world. House of Anansi. Pp 35-78.
[3] Salama, J. (May 18, 2022). This woman navigated a 3,000-mile Pacific voyage without maps or technology. National Geographic.
[4] The world’s biomes. Museum of Paleontology, UC Berkeley.
Attributions:
“Wayfinding: Polynesian Mastery in Navigation” is adapted from “Latitude and Longitude” by the Open Learn University, licensed under CC BY-NC-SA 4.0; and from Martins, K. (Aug 7, 2020). Polynesian Navigation and Settlement of the Pacific, World History Encyclopedia, CC BY-NC-SA 4.0.
"Biomes" is adapted from Darstrup, A. Koppen Climate Classification System. Physical Geography & Natural Disasters; CC BY-NC-SA 4.0; and Southworth, J., Ryan, S. J., Herrero, H. V., Khatami, R., Bunting, E. L., Hassan, M., ... & Waylen, P. Latitudes and Land Use: Global Biome Shifts in Vegetation Persistence Across Three Decades. Frontiers in Remote Sensing, 4, 3. CC BY 4.0; and Biomes by NASA, permitted use.
This page contains adaptations from “The Spatial Perspective” by Caitlin Finlayson and “Geography Basics: Latitudes & Global Climates” by University of Minnesota, both CC BY-NC-SA 3.0.