Explain trends in life expectancies, including factors that contribute to longer life
The “Graying” of America
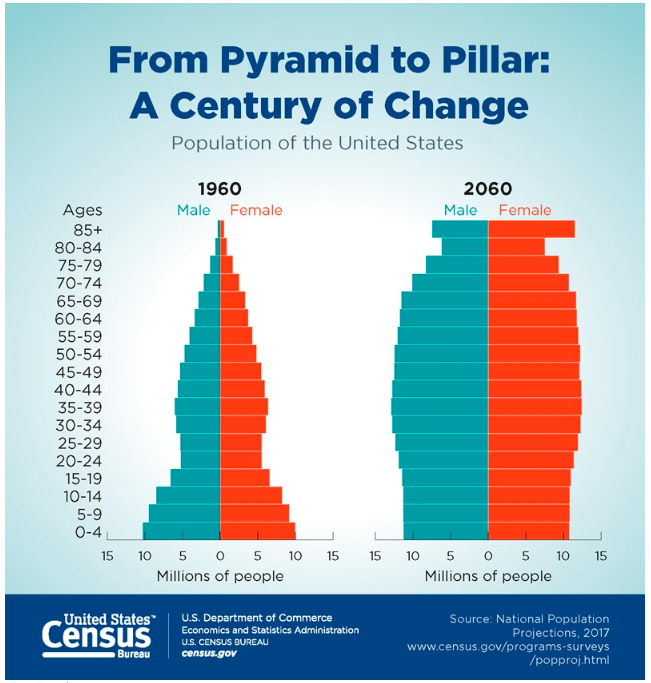
The term “graying of America” refers to the fact that the American population is steadily becoming more dominated by older people. In other words, the median age of Americans is going up.
According to the U.S. Census Bureau’s 2017 National Population Projections, the year 2030 marks an important demographic turning point in U.S. history. By 2030, all baby boomers will be older than age 65. This will expand the size of the older population so that 1 in every 5 residents will be retirement age. And by 2035, it’s projected that there will be 76.7 million people under the age of 18 but 78 million people above the age of 65. [1]
Figure 1. 2030 marks an important demographic change as international migration is expected to overtake natural increase in the United States.
The 2030s are projected to be a transformative decade for the U.S. population. The population is expected to grow at a slower pace, age considerably and become more racially and ethnically diverse. Net international migration is projected to overtake natural increase in 2030 as the primary driver of population growth in the United States, another demographic first for the United States.
Although births are projected to be nearly four times larger than the level of net international migration in coming decades, a rising number of deaths will increasingly offset how much births are able to contribute to population growth. Between 2020 and 2050, the number of deaths is projected to rise substantially as the population ages and a significant share of the population, the baby boomers, age into older adulthood. As a result, the population will naturally grow very slowly, leaving net international migration to overtake natural increase as the leading cause of population growth, even as projected levels of migration remain relatively constant.[2]
“Graying” Around the World
While the world’s oldest countries are mostly in Europe today, some Asian and Latin American countries are quickly catching up. The percentage of the population aged 65 and over in 2015 ranged from a high of 26.6 percent for Japan to a low of around 1 percent for Qatar and United Arab Emirates. Of the world’s 25 oldest countries, 22 are in Europe, with Germany and Italy leading the ranks of European countries for many years (He, Goodkind, and Kowal, 2015).
By 2050, Slovenia and Bulgaria are projected to be the oldest European countries. Japan, however, is currently the oldest nation in the world and is projected to retain this position through at least 2050. With the rapid aging taking place in Asia, the countries of South Korea, Hong Kong, and Taiwan are projected to join Japan at the top of the list of oldest countries and areas by 2050, when more than one-third of these Asian countries’ total populations are projected to be aged 65 and over.[3]
Life Expectancy
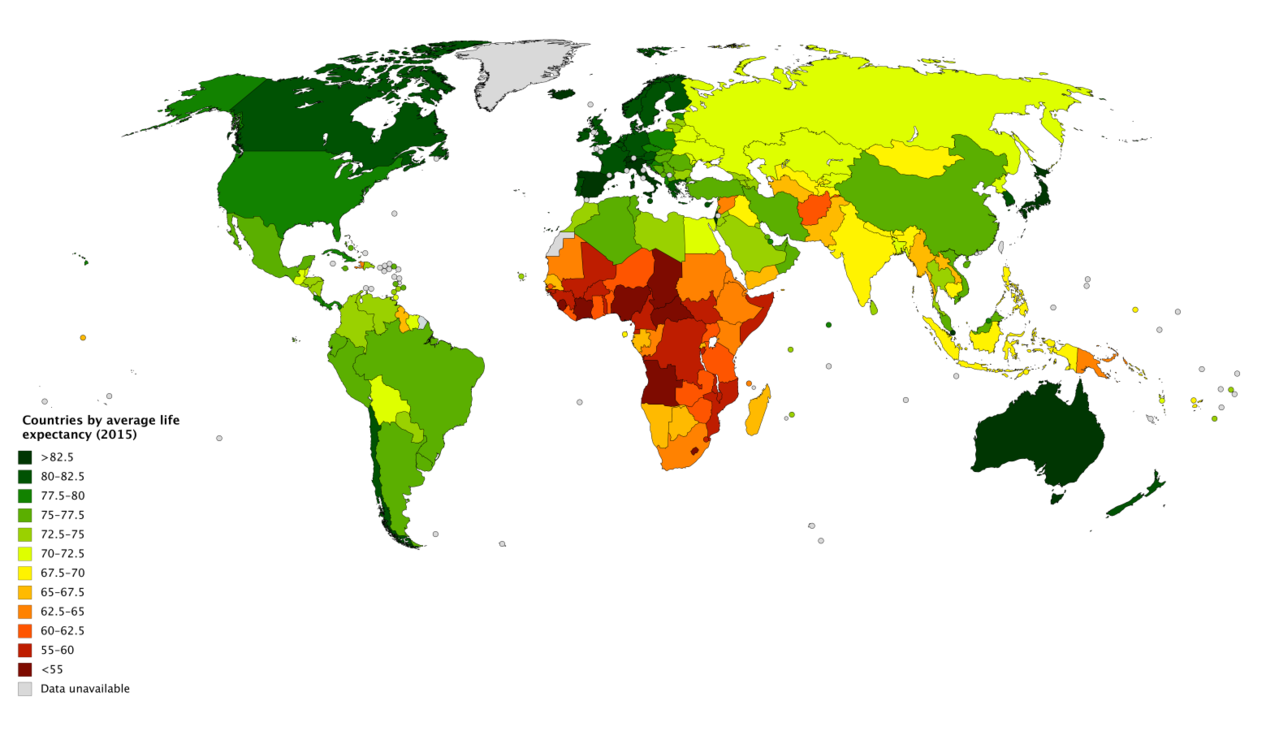
Life expectancy is a statistical measure of the average time an organism is expected to live, based on the year of birth, current age and other demographic factors including gender. The most commonly used measure of life expectancy is at birth (LEB). There are great variations in life expectancy in different parts of the world, mostly due to differences in public health, medical care, and diet, but also affected by education, economic circumstances, violence, mental health, and sex.
Figure 2. Life expectancies around the world in 2015.
Life Expectancy in the United States
According to the CDC (Centers for Disease Control and Prevention), life expectancy in the U.S. now stands at 78.7 years. Women continue to outlive men, with life expectancy being 76.3 years for males, and 81.1 years for females. Life expectancy varies according to race and ethnicity. It is highest for Hispanics, for both males and females, and lower for blacks than for whites or Hispanics.
Figure 3. Life expectancy at birth, by race and Hispanic origin: United States, 2013 and 2014. From CDC/NCHS, National Vital Statistics System, Mortality.
Statistics from the U.S. Census Bureau reveal that the 85-and over age group is the fastest-growing age group in America. According to the Census Bureau and AgingStats.gov, the over-65 population grew from 3 million in 1900 to 40 million in 2010, an increase of more than 1200%. But during this same time, the over-85 population grew from just over 100,000 in 1900 to 5.5 million in 2010–an increase of 5400%!
When calculating life expectancy, we consider all of the elements of heredity, health history, current health habits, and current life experiences which contribute to a longer life or subtract from a person’s life expectancy. Recent studies concluded that cutting calorie intake by 15 percent over two years can slow aging and protect against diseases such as cancer, diabetes, and Alzheimer’s.[4]
Some life factors are beyond a person’s control, and some are controllable. The rising cost of health care is a source of financial vulnerability to older adults. Vaccines are especially important for older adults. As you get older you’re more likely to get diseases like the flu, pneumonia, and shingles, and to have complications that can lead to long-term illness, hospitalization, and even death.
Things that contribute to longer life expectancies include eating a healthy diet that is rich in plants and nuts. Staying physically active, not smoking, and consuming moderate amounts of alcohol, tea, or coffee are also reported to be beneficial to leading a long life. Other recommendations include being conscientious, prioritizing your happiness, avoiding stress and anxiety, and having a strong social support network. Establishing a consistent sleep schedule and maintaining between 7-8 hours of sleep per night is also beneficial.[5]
A major reason a person will statistically live longer once they reach an older age is simply that they have made it this far without anything killing them. Also, there appears to be several factors which may explain changes in life expectancy in the United States and around the world—health conditions are better, many diseases have been eliminated or better controlled through medicine, working conditions are better and better lifestyles choices are being made. Such factors significantly contribute to longer life expectancies.
Life Expectancy Tables
Sometimes referred to mortality tables, death charts or actuarial life tables, these life expectancy tables are strictly statistical, and do not take into consideration any personal health information or lifestyle information. Take a look at life expectancy tables on the Life Expectancy Calculators website.
Life expectancy is also used in describing the physical quality of life. Quality of life is the general well-being of individuals and societies, outlining negative and positive features of life. Quality of life considers life satisfaction, including everything from physical health, family, education, employment, wealth, safety, security, freedom, religious beliefs, and the environment.
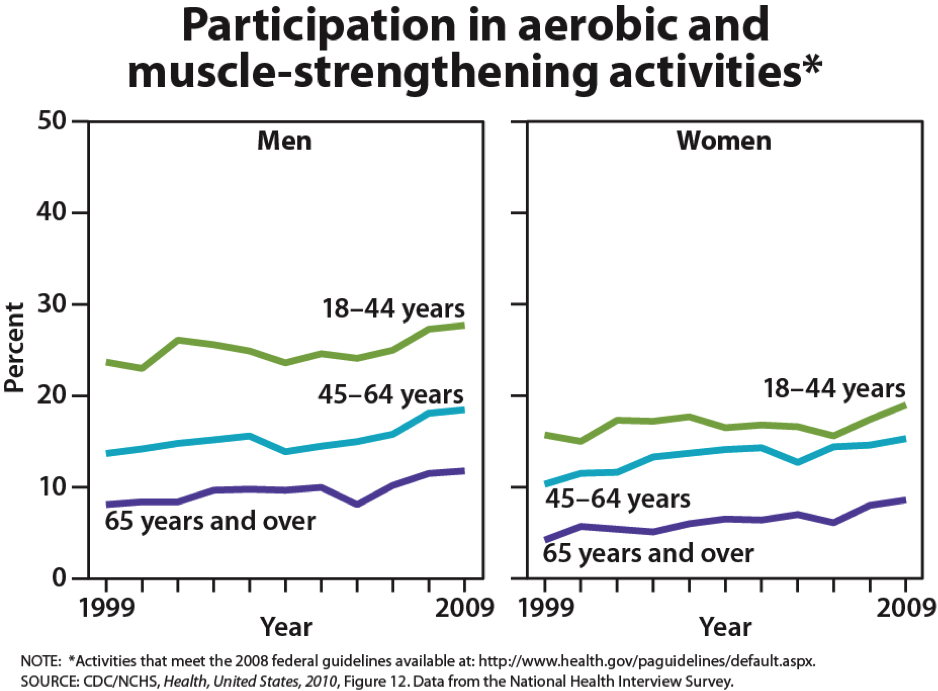
Figure 5. Physical activity remains low for those above age 65, although exercise can have tremendous health benefits and result in longer life expectancy.
Increased life expectancy brings concern over the health and independence of those living longer. Greater attention is now being given to the number of years a person can expect to live without disability, which is called active life expectancy. When this distinction is made, we see that although women live longer than men, they are more at risk of living with disability (Weitz, 2007).
What factors contribute to poor health in women? Marriage has been linked to longevity, but spending years in a stressful marriage can increase the risk of illness. This negative effect is experienced more by women than men and seems to accumulate through the years. The impact of a stressful marriage on health may not occur until a woman reaches 70 or older (Umberson, Williams, et. al., 2006). Sexism can also create chronic stress. The stress experienced by women as they work outside the home as well as care for family members can also ultimately have a negative impact on health (He et als, 2005).
The shorter life expectancy for men in general, is attributed to greater stress, poorer attention to health, more involvement in dangerous occupations, and higher rates of death due to accidents, homicide, and suicide. Social support can increase longevity. For men, life expectancy and health seems to improve with marriage. Spouses are less likely to engage in risky health practices and wives are more likely to monitor their husband’s diet and health regimes. But men who live in stressful marriages can also experience poorer health as a result.
Health and Sexuality
It has been suggested that an active sex life can increase longevity among the elderly.[6]Dr. Maggie Syme found in her research on sexuality in old age that, “Having a sexual partnership, with frequent sexual expression, having a good quality sex life, and being interested in sex have been found to be positively associated with health among middle-aged and older adults.”[7]Positive sexual health in older age is gradually becoming more of a common topic and less taboo. Population percentage increase among older Americans has resulted in placing more attention on the needs of this age group, including their ideas on sexual health, desires, and attitudes. This shift in attitudes and behaviors, combined with medical advances to prolong a sexually active life, has changed the landscape of aging sexuality.
There are a number of associated health benefits with practicing positive sexual health. Positive sexual health often acts as a de-stressor promoting increased relaxation. Researchers also report health benefits such as decreased pain sensitivity, improved cardiovascular health, lower levels of depression, increased self-esteem, and better relationship satisfaction. This could also imply that there are negative consequences of poor sexual health or lack of sexual activity, including depression, low self-esteem, increased frustration, and loneliness.
Key players in improving the quality of life among older adults are the adults themselves. By exercising, reducing stress, not smoking, limiting use of alcohol, consuming more fruits and vegetables, and eating less meat and dairy, older adults can expect to live longer and more active lives (He et. als, 2005). Regular exercise is also associated with a lower risk of developing neurodegenerative disorders, especially Alzheimer’s disease and Parkinson’s disease. Stress reduction both in late adulthood and earlier in life is also crucial. The reduction of societal stressors can promote active life expectancy. In the last 40 years, smoking rates have decreased, but obesity has increased, and physical activity has only modestly increased.
the number of years a person can expect to live without disability
life expectancy
a statistical measure of the average time an organism is expected to live, based on the year of its birth, its current age and other demographic factors including gender
quality of life
the general well-being of individuals and societies, including life satisfaction, physical health, family, education, employment, wealth, safety, security, freedom, religious beliefs, and the environment
Syme, Maggie. (2014). The evolving concept of older adult sexual behavior and its benefits. Generations. 38. 35-41. mailto:/Sandboxes/lhrli@ucdavis.edu
Contributors and Attributions
CC licensed content, Original
Modification, adaptation, and original content. Authored by: Sonja Ann Miller for Lumen Learning. Provided by: Lumen Learning. License: CC BY-SA: Attribution-ShareAlike
Life expectancy at birth by race. Authored by: Elizabeth Arias, Ph.D.. Provided by: Centers for Disease Control and Prevention. Project: NCHS Data Brief No. 244, April 2016 . License: All Rights Reserved