
Exercises for Chapter 7
- Page ID
- 16379

\( \newcommand{\vecs}[1]{\overset { \scriptstyle \rightharpoonup} {\mathbf{#1}} } \)
\( \newcommand{\vecd}[1]{\overset{-\!-\!\rightharpoonup}{\vphantom{a}\smash {#1}}} \)
\( \newcommand{\dsum}{\displaystyle\sum\limits} \)
\( \newcommand{\dint}{\displaystyle\int\limits} \)
\( \newcommand{\dlim}{\displaystyle\lim\limits} \)
\( \newcommand{\id}{\mathrm{id}}\) \( \newcommand{\Span}{\mathrm{span}}\)
( \newcommand{\kernel}{\mathrm{null}\,}\) \( \newcommand{\range}{\mathrm{range}\,}\)
\( \newcommand{\RealPart}{\mathrm{Re}}\) \( \newcommand{\ImaginaryPart}{\mathrm{Im}}\)
\( \newcommand{\Argument}{\mathrm{Arg}}\) \( \newcommand{\norm}[1]{\| #1 \|}\)
\( \newcommand{\inner}[2]{\langle #1, #2 \rangle}\)
\( \newcommand{\Span}{\mathrm{span}}\)
\( \newcommand{\id}{\mathrm{id}}\)
\( \newcommand{\Span}{\mathrm{span}}\)
\( \newcommand{\kernel}{\mathrm{null}\,}\)
\( \newcommand{\range}{\mathrm{range}\,}\)
\( \newcommand{\RealPart}{\mathrm{Re}}\)
\( \newcommand{\ImaginaryPart}{\mathrm{Im}}\)
\( \newcommand{\Argument}{\mathrm{Arg}}\)
\( \newcommand{\norm}[1]{\| #1 \|}\)
\( \newcommand{\inner}[2]{\langle #1, #2 \rangle}\)
\( \newcommand{\Span}{\mathrm{span}}\) \( \newcommand{\AA}{\unicode[.8,0]{x212B}}\)
\( \newcommand{\vectorA}[1]{\vec{#1}} % arrow\)
\( \newcommand{\vectorAt}[1]{\vec{\text{#1}}} % arrow\)
\( \newcommand{\vectorB}[1]{\overset { \scriptstyle \rightharpoonup} {\mathbf{#1}} } \)
\( \newcommand{\vectorC}[1]{\textbf{#1}} \)
\( \newcommand{\vectorD}[1]{\overrightarrow{#1}} \)
\( \newcommand{\vectorDt}[1]{\overrightarrow{\text{#1}}} \)
\( \newcommand{\vectE}[1]{\overset{-\!-\!\rightharpoonup}{\vphantom{a}\smash{\mathbf {#1}}}} \)
\( \newcommand{\vecs}[1]{\overset { \scriptstyle \rightharpoonup} {\mathbf{#1}} } \)
\(\newcommand{\longvect}{\overrightarrow}\)
\( \newcommand{\vecd}[1]{\overset{-\!-\!\rightharpoonup}{\vphantom{a}\smash {#1}}} \)
\(\newcommand{\avec}{\mathbf a}\) \(\newcommand{\bvec}{\mathbf b}\) \(\newcommand{\cvec}{\mathbf c}\) \(\newcommand{\dvec}{\mathbf d}\) \(\newcommand{\dtil}{\widetilde{\mathbf d}}\) \(\newcommand{\evec}{\mathbf e}\) \(\newcommand{\fvec}{\mathbf f}\) \(\newcommand{\nvec}{\mathbf n}\) \(\newcommand{\pvec}{\mathbf p}\) \(\newcommand{\qvec}{\mathbf q}\) \(\newcommand{\svec}{\mathbf s}\) \(\newcommand{\tvec}{\mathbf t}\) \(\newcommand{\uvec}{\mathbf u}\) \(\newcommand{\vvec}{\mathbf v}\) \(\newcommand{\wvec}{\mathbf w}\) \(\newcommand{\xvec}{\mathbf x}\) \(\newcommand{\yvec}{\mathbf y}\) \(\newcommand{\zvec}{\mathbf z}\) \(\newcommand{\rvec}{\mathbf r}\) \(\newcommand{\mvec}{\mathbf m}\) \(\newcommand{\zerovec}{\mathbf 0}\) \(\newcommand{\onevec}{\mathbf 1}\) \(\newcommand{\real}{\mathbb R}\) \(\newcommand{\twovec}[2]{\left[\begin{array}{r}#1 \\ #2 \end{array}\right]}\) \(\newcommand{\ctwovec}[2]{\left[\begin{array}{c}#1 \\ #2 \end{array}\right]}\) \(\newcommand{\threevec}[3]{\left[\begin{array}{r}#1 \\ #2 \\ #3 \end{array}\right]}\) \(\newcommand{\cthreevec}[3]{\left[\begin{array}{c}#1 \\ #2 \\ #3 \end{array}\right]}\) \(\newcommand{\fourvec}[4]{\left[\begin{array}{r}#1 \\ #2 \\ #3 \\ #4 \end{array}\right]}\) \(\newcommand{\cfourvec}[4]{\left[\begin{array}{c}#1 \\ #2 \\ #3 \\ #4 \end{array}\right]}\) \(\newcommand{\fivevec}[5]{\left[\begin{array}{r}#1 \\ #2 \\ #3 \\ #4 \\ #5 \\ \end{array}\right]}\) \(\newcommand{\cfivevec}[5]{\left[\begin{array}{c}#1 \\ #2 \\ #3 \\ #4 \\ #5 \\ \end{array}\right]}\) \(\newcommand{\mattwo}[4]{\left[\begin{array}{rr}#1 \amp #2 \\ #3 \amp #4 \\ \end{array}\right]}\) \(\newcommand{\laspan}[1]{\text{Span}\{#1\}}\) \(\newcommand{\bcal}{\cal B}\) \(\newcommand{\ccal}{\cal C}\) \(\newcommand{\scal}{\cal S}\) \(\newcommand{\wcal}{\cal W}\) \(\newcommand{\ecal}{\cal E}\) \(\newcommand{\coords}[2]{\left\{#1\right\}_{#2}}\) \(\newcommand{\gray}[1]{\color{gray}{#1}}\) \(\newcommand{\lgray}[1]{\color{lightgray}{#1}}\) \(\newcommand{\rank}{\operatorname{rank}}\) \(\newcommand{\row}{\text{Row}}\) \(\newcommand{\col}{\text{Col}}\) \(\renewcommand{\row}{\text{Row}}\) \(\newcommand{\nul}{\text{Nul}}\) \(\newcommand{\var}{\text{Var}}\) \(\newcommand{\corr}{\text{corr}}\) \(\newcommand{\len}[1]{\left|#1\right|}\) \(\newcommand{\bbar}{\overline{\bvec}}\) \(\newcommand{\bhat}{\widehat{\bvec}}\) \(\newcommand{\bperp}{\bvec^\perp}\) \(\newcommand{\xhat}{\widehat{\xvec}}\) \(\newcommand{\vhat}{\widehat{\vvec}}\) \(\newcommand{\uhat}{\widehat{\uvec}}\) \(\newcommand{\what}{\widehat{\wvec}}\) \(\newcommand{\Sighat}{\widehat{\Sigma}}\) \(\newcommand{\lt}{<}\) \(\newcommand{\gt}{>}\) \(\newcommand{\amp}{&}\) \(\definecolor{fillinmathshade}{gray}{0.9}\)Exercise 7.1 Suppose a government is established in a country where none previously existed. The government spends 100, financed by borrowing, to provide public services. If autonomous consumption, investment and exports minus imports are 200 and the marginal propensity to consume MPC = 0.75, and the MPM = 0.15, what are the equilibrium real GDP values before and after the government is established.
Exercise 7.2 If the government expenditure in Exercise 7.1 were financed by imposing a net tax rate on income of t = 0.10:
(a) Calculate and compare the slopes of the AE functions in Exercises 7.1 and 7.2.
(b) Calculate and compare the multipliers in Exercises 7.1 and 7.2.
(c) What is the equilibrium real GDP in Exercise 7.2 compared to Exercise 7.1.
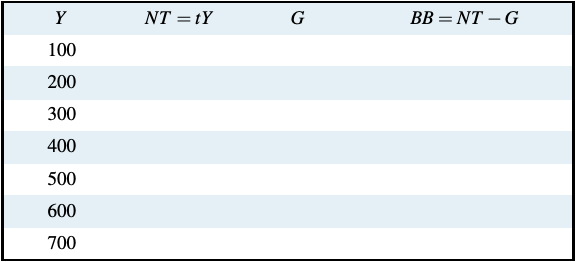
Exercise 7.3 If government expenditure is 100 and the net tax rate is t = 0.20:
(a) Complete the following table:
(b) In a diagram with national income Y on the horizontal axis and government revenue and expenditure on the vertical axis, draw the government expenditure and net tax functions. Explain the intercept on the vertical axis, and the slope you have given to the NT and G functions in your diagram.
(c) Suppose the government cuts the tax rate to t = 0.15. Show the effects in your diagram.
Exercise 7.4 Draw diagrams to illustrate the initial equilibrium national income, the effect of the increase in government expenditure on equilibrium national income, and the government’s budget functions and balances before and after the increase in government expenditure.
Exercise 7.5 Suppose the government raises its revenue by a net tax of 25 percent on income, t = 0.25, the marginal propensity to consume out of disposable income is 0.8 and the marginal propensity to import is m = 0.15.
(a) What is the slope of the AE function? What is the size of the multiplier?
(b) Autonomous expenditure by the non-government sectors \((C_0 + I_0 + X_0 − IM_0)\) is 300 and government expenditure is 400. What is the equilibrium income and output? What is the government’s budget balance?
(c) The government increases its expenditures by 100 to provide additional funding for national defense. What is the effect on equilibrium income and output? What is the effect on the government’s budget balance?
Exercise 7.6 An economy is in equilibrium at a real GDP of 750, but current estimates put potential output at YP = 850.
(a) Is there an inflationary or a recessionary gap, and, if there is either, what is its size?
(b) Research suggests that the MPC is 0.75, the MPM is 0.10, and the net tax rate is 0.20. If there is a gap, what change in government expenditure would eliminate the gap?
(c) If the government preferred to change its net tax rate to eliminate the gap, and not change government expenditure, what new tax rate would be required to eliminate the gap?
Exercise 7.7
(a) Draw a diagram that shows the government’s budget balance relative to national income. Explain briefly the vertical intercept of the budget function and its slope.
(b) Using your diagram from (b), show the structural budget balance and a situation in which the actual balance is different from the structural balance.
(c) Based on this diagram, show and explain the difference between the budget effects of automatic stabilization and discretionary fiscal policy.
Exercise 7.8 Suppose the MPC = 0.8, the tax rate t = 0.1, the MPM = 0.12 and autonomous aggregate expenditure A = 1000, including government expenditure G = 20. Further assume the government has an outstanding public debt of 1000.
(a) What is the initial debt to GDP or debt to national income ratio?
(b) Suppose government increased its expenditure by ∆G = 10, without any increase in the tax rate. What are the new equilibrium national income and the government’s new budget balance?
(c) What is the outstanding public debt and the public debt ratio at the new equilibrium income, assuming the economy has reached its new equilibrium national income in one year?