Calculating Economic Growth
Economic growth is the increase in the market value of goods and services produced by an economy over time; the percentage rate of increase in the GDP.
learning objectives
- Calculate various measures of economic growth
Economic Growth
Economic growth is defined as the increase in the market value of goods and services produced by an economy over time. It is usually measured as a percentage rate of increase in the real gross domestic product. In economics, economic growth refers to the growth of potential output. It shows how a country is developing its economy. Economic growth is directly impacted by human capital, which is the level of school or knowledge attainment in a country. The cognitive skills of a population directly impact economic growth. In general, economic growth is recorded and studied over the short-run and long-run.
Short-run Economic Growth
The business cycle refers to economy-wide fluctuations in production, trade, and economic activity over several months or years. The short-run variation in economic growth is called the business cycle. Economists use it to distinguish between short-run variations in economic growth and long-run economic growth. The cycle is made up of increases and decreases in production that occur over months and years. The changes in the business cycle are a result of fluctuations in aggregate demand.
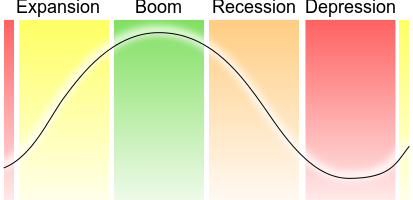
The Business Cycle: The business cycle is used to determine the short-run variation in economic growth. Variations in the business cycle fluctuation over months and years and are attributed to fluctuations in aggregate demand.
Long-run Economic Growth
Long-run economic growth is measured as the percentage rate increase in the real gross domestic product. The GDP is defined as the market value of all officially recognized final goods and services produced within a country in a given period of time. There are three approaches used to determine the GDP:
- Product (output) approach: adds together the outputs of every class of enterprise to provide the total.
- Income approach: calculates the sum of all the producers’ incomes.
- Expenditure approach: the value of the total product must be equal to the people’s total expenditures.
In principle, all of the approaches should yield the same result for the GDP of a country.
For example, the equation for the expenditure approach is: \(\mathrm{GDP = C + I + G + (X – M)}\).
Written out in full, the gross domestic product (GDP) equals private consumption (C) plus, gross investment (I), government spending (G), and the exports minus the imports (X – M).
For economic purposes, the economic growth is calculated and compared to the population, also know as per capita income (indicator of a country’s standard of living). When the per capita income increases it is called intensive growth. When the GDP growth is only caused by increases in population or territory it is called extensive growth.
Growth in the United States
The economy in the United States is the world’s largest single national economy; 2013 GDP estimation was $16.6 trillion.
learning objectives
- Describe historical growth in the US
Economic Growth
Economic growth is defined as the increase in the market value of the goods and services produced by an economy over time. It is measured as the percentage rate of increase in the real gross domestic product (GDP). To determine economic growth, the GDP is compared to the population, also know as the per capita income. When the per capita income increases it is called intensive growth. When the GDP growth is only cause by an increase in population or territory it is called extensive growth.
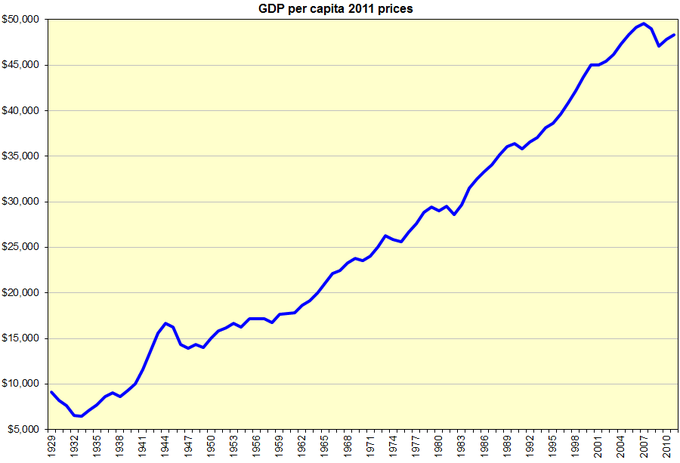
U.S. GDP per capita (1929-2010): This graph shows the GDP per capita in the United States from 1929 to 2010. The GDP per capita is the ratio of the GDP to the population. This graph shows the intensive growth of the United States during this time period.
U.S. Economy
The economy in the United States is the world’s largest single national economy. In 2013, the estimated GDP was $16.6 trillion, which is a quarter of the nominal global GDP. Currently, the U.S. has a mixed economy, a stable GDP growth rate, moderate unemployment, and high levels of research and capital investment.
U.S. Economic Growth
Throughout its history, the U.S. has experienced economic growth in varying degrees. Various historical time periods illustrate the rate of growth:
- Prior to industrialization: technological progress caused an increase in population, which was kept in check by food supply and other resources. The per capita income was limited.
- Industrial Revolution: a period of rapid economic growth. Despite the initial excess of population growth, the growth did eventually slow down; a condition called demographic transition. During the first Industrial Revolution mechanization was introduced. During the second Industrial Revolution, wind and water power replaced human and animal labor. This increased the level of production.
- 20th century growth: most economic growth in the 20th century was due to reduced inputs of labor, materials, energy, and land per unit of economic output. The growth was more balanced because more inputs were used due to the growth of output. Also, this time period experienced the production of new goods and services through innovations.
- 1920s: during this time period there was overproduction which was one cause of the Great Depression in the 1930s. Economic growth resumed following the depression and was aided by the demand for new goods and services (telephones, radios, televisions, etc. ).
- 1940 to 1970: the U.S. economy grew by an average of 3.8% and the real median household income surged 74% (2.1% a year).
- 1960s: the U.S. economy experienced its most extensive periods of economic growth from 1961 to 1969 with an expansion of 53% (5.1% a year).
- 1970s: the economy experienced slower growth after 1973. The average growth was 2.7%, there were stagnant living conditions, and household incomes increased by 10% (0.3% annually). The 1973 oil crisis caused the GDP to fall 3.7%. The GDP fell again in late 1973 to 1975 (3.1%).
- 1980s: the U.S. share of the world GDP peaked in 1985 with 23.78% of global GDP. There was a recession from 1981 to 1982 when the GDP dropped by 2.9%.
- 1990s: there was a mild recession in 1990 to 1991 when the output fell by 1.3%.
- 2000s: one of the worst recessions in recent decades occurred in 2008 when the GDP fell by 5.% in one year. The 2008 financial crisis was caused by a derivatives market, the subprime mortgage crisis, and a declining dollar value.
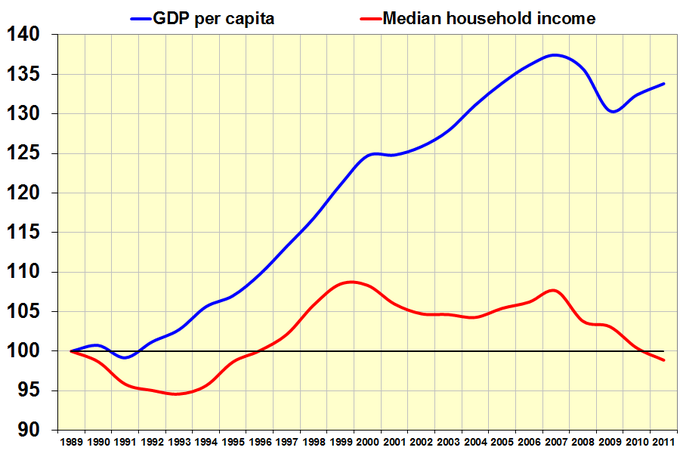
U.S. GDP vs. Household Income (1989-2011): This graph shows the relationship of the GDP in the United States to the household income. This period from 1989 to 2011 was hit by a number of recessions.
Growth in the Rest of the World
On a global scale, economic growth is the sum of the growth of individual countries to give a worldwide total.
learning objectives
- Describe historical growth in developing and developed countries
Economic Growth
Economic growth is the increase in the market value of goods and services produced by an economy over a period of time. It is measured as the percentage rate increase in the real gross domestic product (GDP). On a global scale, economic growth is the sum of the growth of individual countries to give a worldwide total. Economic growth and global impact varies by country based on the individual economy, the development of the country, accumulation of human and physical capital, and level of productivity.
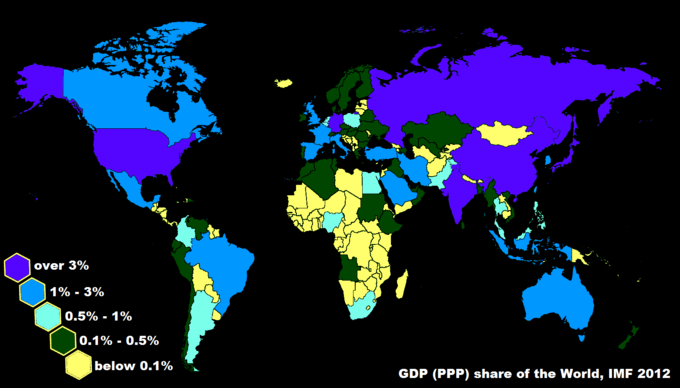
Share of World GDP: This image shows the share of GDP worldwide. The economic growth and global impact that each country has is influenced by the individual economy, the development of the country, accumulation of human and physical capital, and level of productivity.
Global Economic Growth
Due to the vast number of countries globally, the world economy is usually determined in monetary terms, even in cases where no efficient market is available to evaluate goods and services. The market valuations are translated into a single monetary unit using the idea of purchasing power. Analyzing economic growth in prominent countries provides an overview of global economic growth.
Change in GDP: This graph shows the change in GDP for countries around the world for 1900 to 1999 and 1999 to 2006. The GDP for each individual country is used to determine the global economic growth.
- 1980 to 1990: during this time period the economic output of 112 countries expanded while the output of 34 countries contracted. The purchasing power expanded for 145 markets and contracted for two. The five largest contributors to global output contraction were Argentina, Saudi Arabia, Nigeria, Venezuela, and Vietnam.
- 1990 to 2000: the United States dominated expansion during these years. The economic output expanded for 122 countries and contracted for 29. The purchasing power increased for 148 markets and contracted for three. The five largest contributors to global output contraction were Italy, Finland, Bulgaria, Algeria, and the Demographic Republic of Congo.
- 2000 to 2006: Expansion in China moved the country closer to the United States. The economic output for 176 countries expanded and four contracted. The five largest contributors to the expansion were the United States, China, Germany, the United Kingdom, and France. The purchasing power increased for 180 markets. The largest global output contributors were the United States, China, India, Japan, and Russia. From 2000 to 2010 these was a rise in developing and emerging economies.
- 2007: The nominal GDP expanded in 183 countries. The largest contributors were China, the U.S., Germany, and the United Kingdom.
- 2008: the credit crisis started. Economic output expanded in 171 countries, but 11 countries experienced output contractions. The United Kingdom accounted for half the global contraction while South Korea accounted for two-fifths. The crisis impacted most countries, but it was not deep enough to reverse growth.
- 2009: the credit crisis spread. The economic output of 127 countries contracted. The United Kingdom was impacted the most, followed by Russia and Germany. 56 countries experienced expansion of economic output, including China, Japan, and Indonesia. The purchasing power contracted for 79 markets. The U.S. was the largest victim and accounted for 18%, followed by Japan and Russia. 104 markets expanded purchasing power including China, India, and Indonesia.
- 2010: the economic output expanded for 148 countries and contracted for 35. The purchasing power increased for 169 markets and contracted for 14. It was noted that banks faced a “wall” of maturing debt. The U.S. experienced economic recovery, but the global economic growth lost momentum.
- 2011 to 2012: in 2011 it was projected that global growth would drop 4% followed by another 3.5% drop in 2012.
- 2010 to 2018: it is projected that China will lead economic growth during this period. The global economic output is expected to expand by $32.9 trillion.
Power of Annual Growth
Over long periods of time, small rates of growth have large economic effects. For example, the United Kingdom experienced a 1.97% average annual increase in its GDP from 1830 to 2008. The growth rate averaged 1.97% over 178 years and resulted in a 32-fold increase in the GDP by 2008. The GDP in 1830 was £41,373. It grew to £1,330,088 by 2008.
A growth rate of 2.5% a year leads to a doubling of the GDP within 29 years. A growth rate of 8% a year leads to a doubling of the GDP in 10 years. As a result, small differences in economic growth rates between countries can produced very different standards of living for the populations if the small growth rate continues for many years.
Catch-Up: Possible, but not Certain
Developing countries can catch up to developed countries by achieving growing faster, which is determined by a wide number of country-specific factors.
learning objectives
- Describe different factors that affect the growth rate of developing economies
Economic Growth
Economic growth is defined as the increase in the market value of the goods and services produced by an economy over time. In order to assess economic growth it must be measured. It is the percentage rate of increase in real gross domestic product (GDP). When looking at the long-term economic growth of a country, it is important to analyze the ratio of the GDP to the population (GDP per capita).
For a developing country to catch up to a developed country, it must not only grow, but grow faster than the developed country. It is possible for such accelerated growth to occur, but there are many country-specific factors that affect a country’s ability to catch up to developed countries.
Factors that Impact Economic Growth
There are specific factors that have a direct impact on the economic growth of a country. Every country is unique based on population, technology, government, wealth, etc. Economic growth can be compared between countries, although no two countries are the same. Some of the factors that impact economic growth include:
- Growth of productivity: the growth of productivity is the ratio of economic output to input (capital, labor, energy, materials, and services). When productivity increases the cost of goods decreases causing an increase in the per capita GDP. Lower prices create an increase in higher aggregate demand. The growth of productivity is the driving force behind economic growth.
- Demographics: demographics change the employment to population ratio as well as the labor force participation rate. The age structure of the population affects the labor force participation rate. For example, when women entered the workforce in the U.S. it contributed to economic growth, as did the entrance of the baby boomers into the workforce.
- Labor force participation: the rate of labor force participation impacts economic growth. It is the number of people working in the labor force. When manufacturing increased, it created a higher productivity rate, but lowered the labor force participation, prices fell, and employment shrank.
- Human capital: human capital is referred to as the skills of the population. Education is a commonly used measurement for human capital. Human capital increases the society’s skill which increases economic growth.
- Inequality: inequality in wealth and income has a negative impact on economic growth. Inequality results in high and persistent unemployment. This has a negative effect on long-run economic growth.
- Trade: international trade represents a significant part of GDP for most countries. It is the exchange of goods and services across national borders.
- Quality of life: happiness has been shown to increase with a higher GDP per capita. Quality of life is a direct result of economic growth. When poverty is alleviated and society has access to what it needs, the quality of life increases. Consistent quality of life leads to continued economic growth.
- Employment rate: in order for the employment rate to have a positive impact on economic growth there must also be increases in productivity. If employment increases, but productivity does not, then there is a higher number of working poor.
Economic Growth in Developing Countries
The economic growth of any country takes time to develop. Some countries have much larger, stronger, and more developed economies than other countries. The study of the economic aspects of development in low-income countries is called development economics. It focuses on methods for promoting economic development. All of the factors listed previously impact economic growth – most of them positively. It is possible, but not certain that smaller, underdeveloped economies can experience economic growth and catch-up to more prominent economies.
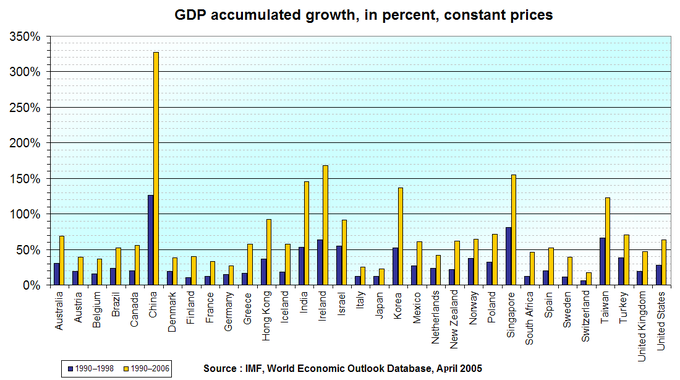
Change in GDP: This graph shows the change in GDP for various countries for the periods of 1990 to 1998 and 1990 to 2006. It is obvious that certain countries have larger and more developed economies than other countries. It is possible for countries with weaker economies to catch up with larger countries, but it is not certain.
Key Points
- In economics, economic growth refers to the growth of potential output. It shows how a country is developing its economy.
- The short-run variation in economic growth is called the business cycle. Economists use it to distinguish between short-run variations in economic growth and long-run economic growth.
- Long-run economic growth is measured as the percentage rate increase in the real gross domestic product.
- The GDP can be calculated using the product approach, income approach, or expenditure approach. The GDP is defined as the market value of all officially recognized final goods and services produced within a country in a given period of time.
- Currently, the U.S. has a mixed economy, a stable GDP growth rate, moderate unemployment, and high levels of research and capital investment.
- Throughout its history, the U.S. has experienced economic growth in varying degrees. Time periods can be broken down by century and by decades.
- The U.S. economy experienced its most extensive growth from 1961 to 1969.
- Economic growth and global impact varies by country based on the individual economy, the development of the country, accumulation of human and physical capital, and level of productivity.
- Due to the vast number of countries globally, the world economy is usually determined in monetary terms, even in cases where no efficient market is available to evaluate goods and services.
- From 1990 to 2000 the U.S. dominated in expansion. From 2006 to 2006, China’s expansion moved closer to that of the United States. China led in expansion in 2007.
- The global credit crisis started in 2008 and expanded in 2009. By 2010, the U.S. had experienced some economic recovery while the global economic growth had lost momentum.
- From 2010 to 2018, China is expected to led in expansion. The global economic output is projected to expand.
- Every country is unique based on population, technology, government, wealth, ect. Economic growth can be compared between countries, although no two countries are the same.
- Factors that influence economic growth include: growth of productivity, demographics, labor force participation, human capital, inequality, trade, quality of life, and employment rate.
- The economic growth of any country takes time to develop. Some countries have much larger, stronger, and more developed economies than other countries.
- It is possible, but not certain that smaller, underdeveloped economies can experience economic growth and catch-up to more prominent economies.
Key Terms
- business cycle: A fluctuation in economic activity between growth and recession.
- gross domestic product: A measure of the economic production of a particular territory in financial capital terms over a specific time period.
- economic growth: The increase of the economic output of a country.
- recession: A period of reduced economic activity
- financial crisis: A period of serious economic slowdown characterized by devaluing of financial institutions often due to reckless and unsustainable money lending.
- purchasing power: The amount of goods and services that can be bought with a unit of currency or by consumers.
- demographics: The characteristics of human populations for purposes of social studies.
LICENSES AND ATTRIBUTIONS
CC LICENSED CONTENT, SPECIFIC ATTRIBUTION
- gross domestic product. Provided by: Wiktionary. Located at: en.wiktionary.org/wiki/gross_domestic_product. License: CC BY-SA: Attribution-ShareAlike
- Business cycle. Provided by: Wikipedia. Located at: en.Wikipedia.org/wiki/Business_cycle. License: CC BY-SA: Attribution-ShareAlike
- Gross domestic product. Provided by: Wikipedia. Located at: en.Wikipedia.org/wiki/Gross_domestic_product. License: CC BY-SA: Attribution-ShareAlike
- Aggregate demand. Provided by: Wikipedia. Located at: en.Wikipedia.org/wiki/Aggregate_demand. License: CC BY-SA: Attribution-ShareAlike
- Economic growth. Provided by: Wikipedia. Located at: en.Wikipedia.org/wiki/Economic_growth. License: CC BY-SA: Attribution-ShareAlike
- business cycle. Provided by: Wiktionary. Located at: en.wiktionary.org/wiki/business_cycle. License: CC BY-SA: Attribution-ShareAlike
- economic growth. Provided by: Wiktionary. Located at: en.wiktionary.org/wiki/economic_growth. License: CC BY-SA: Attribution-ShareAlike
- Economic cycle. Provided by: Wikipedia. Located at: en.Wikipedia.org/wiki/File:Economic_cycle.svg. License: Public Domain: No Known Copyright
- US Economy. Provided by: Wikipedia. Located at: en.Wikipedia.org/wiki/US_Economy. License: CC BY-SA: Attribution-ShareAlike
- Economic growth. Provided by: Wikipedia. Located at: en.Wikipedia.org/wiki/Economic_growth. License: CC BY-SA: Attribution-ShareAlike
- recession. Provided by: Wiktionary. Located at: en.wiktionary.org/wiki/recession. License: CC BY-SA: Attribution-ShareAlike
- economic growth. Provided by: Wiktionary. Located at: en.wiktionary.org/wiki/economic_growth. License: CC BY-SA: Attribution-ShareAlike
- financial crisis. Provided by: Wiktionary. Located at: en.wiktionary.org/wiki/financial_crisis. License: CC BY-SA: Attribution-ShareAlike
- Economic cycle. Provided by: Wikipedia. Located at: en.Wikipedia.org/wiki/File:Economic_cycle.svg. License: Public Domain: No Known Copyright
- US GDP per capita. Provided by: Wikipedia. Located at: en.Wikipedia.org/wiki/File:US...per_capita.PNG. License: Public Domain: No Known Copyright
- Gdp versus household income. Provided by: Wikipedia. Located at: en.Wikipedia.org/wiki/File:Gd...old_income.png. License: CC BY-SA: Attribution-ShareAlike
- economic growth. Provided by: Wiktionary. Located at: en.wiktionary.org/wiki/economic_growth. License: CC BY-SA: Attribution-ShareAlike
- purchasing power. Provided by: Wiktionary. Located at: en.wiktionary.org/wiki/purchasing_power. License: CC BY-SA: Attribution-ShareAlike
- gross domestic product. Provided by: Wiktionary. Located at: en.wiktionary.org/wiki/gross_domestic_product. License: CC BY-SA: Attribution-ShareAlike
- Global economy. Provided by: Wikipedia. Located at: en.Wikipedia.org/wiki/Global_economy. License: CC BY-SA: Attribution-ShareAlike
- Economic growth. Provided by: Wikipedia. Located at: en.Wikipedia.org/wiki/Economic_growth. License: CC BY-SA: Attribution-ShareAlike
- Economic cycle. Provided by: Wikipedia. Located at: en.Wikipedia.org/wiki/File:Economic_cycle.svg. License: Public Domain: No Known Copyright
- US GDP per capita. Provided by: Wikipedia. Located at: en.Wikipedia.org/wiki/File:US...per_capita.PNG. License: Public Domain: No Known Copyright
- Gdp versus household income. Provided by: Wikipedia. Located at: en.Wikipedia.org/wiki/File:Gd...old_income.png. License: CC BY-SA: Attribution-ShareAlike
- Share of world gdp 2012 imf. Provided by: Wikipedia. Located at: en.Wikipedia.org/wiki/File:Sh...p_2012_imf.png. License: CC BY-SA: Attribution-ShareAlike
- Gdp accumulated change. Provided by: Wikipedia. Located at: en.Wikipedia.org/wiki/File:Gd...ted_change.png. License: CC BY-SA: Attribution-ShareAlike
- economic growth. Provided by: Wiktionary. Located at: en.wiktionary.org/wiki/economic_growth. License: CC BY-SA: Attribution-ShareAlike
- gross domestic product. Provided by: Wiktionary. Located at: en.wiktionary.org/wiki/gross_domestic_product. License: CC BY-SA: Attribution-ShareAlike
- Development economics. Provided by: Wikipedia. Located at: en.Wikipedia.org/wiki/Development_economics. License: CC BY-SA: Attribution-ShareAlike
- Economic growth. Provided by: Wikipedia. Located at: en.Wikipedia.org/wiki/Economic_growth. License: CC BY-SA: Attribution-ShareAlike
- Trade. Provided by: Wikipedia. Located at: en.Wikipedia.org/wiki/Trade%2...national_trade. License: CC BY-SA: Attribution-ShareAlike
- Boundless. Provided by: Boundless Learning. Located at: www.boundless.com//marketing/...n/demographics. License: CC BY-SA: Attribution-ShareAlike
- Economic cycle. Provided by: Wikipedia. Located at: en.Wikipedia.org/wiki/File:Economic_cycle.svg. License: Public Domain: No Known Copyright
- US GDP per capita. Provided by: Wikipedia. Located at: en.Wikipedia.org/wiki/File:US...per_capita.PNG. License: Public Domain: No Known Copyright
- Gdp versus household income. Provided by: Wikipedia. Located at: en.Wikipedia.org/wiki/File:Gd...old_income.png. License: CC BY-SA: Attribution-ShareAlike
- Share of world gdp 2012 imf. Provided by: Wikipedia. Located at: en.Wikipedia.org/wiki/File:Sh...p_2012_imf.png. License: CC BY-SA: Attribution-ShareAlike
- Gdp accumulated change. Provided by: Wikipedia. Located at: en.Wikipedia.org/wiki/File:Gd...ted_change.png. License: CC BY-SA: Attribution-ShareAlike
- Gdp accumulated change. Provided by: Wikipedia. Located at: en.Wikipedia.org/wiki/File:Gd...ted_change.png. License: CC BY-SA: Attribution-ShareAlike

