Defining Aggregate Expenditure: Components and Comparison to GDP
Aggregate expenditure is the current value of all the finished goods and services in the economy.
learning objectives
- Define aggregate expenditure
Aggregate Expenditure
In economics, aggregate expenditure is the current value of all the finished goods and services in the economy. It is the sum of all the expenditures undertaken in the economy by the factors during a specific time period. The equation for aggregate expenditure is: \(\mathrm{AE = C + I + G + NX}\).
Written out the equation is: aggregate expenditure equals the sum of the household consumption (C), investments (I), government spending (G), and net exports (NX).
- Consumption (C): The household consumption over a period of time.
- Investment (I): The amount of expenditure towards the capital goods.
- Government expenditure (G): The amount of spending by federal, state, and local governments. Government expenditure can include infrastructure or transfers which increase the total expenditure in the economy.
- Net exports (NX): Total exports minus the total imports.
The aggregate expenditure determines the total amount that firms and households plan to spend on goods and services at each level of income.
Comparison to GDP
The aggregate expenditure is one of the methods that is used to calculate the total sum of all the economic activities in an economy, also known as the gross domestic product (GDP). The gross domestic product is important because it measures the growth of the economy. The GDP is calculated using the Aggregate Expenditures Model.
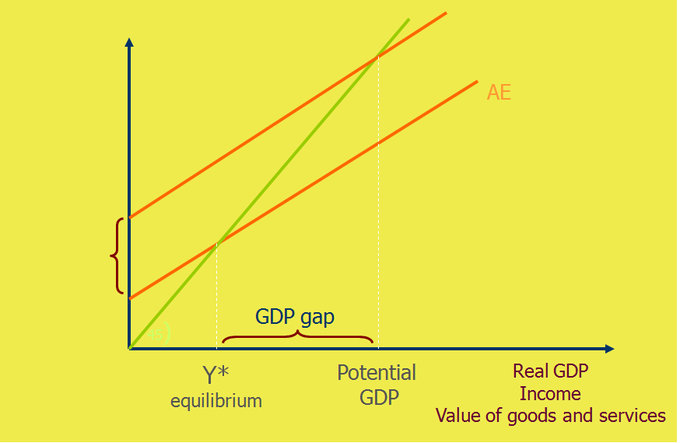
Aggregate Expenditure: This graph shows the aggregate expenditure model. It is used to determine and graph the real GPD, potential GDP, and point of equilibrium. A shift in supply or demand impacts the GDP.
An economy is at equilibrium when aggregate expenditure is equal to the aggregate supply (production) in the economy. The economy is not in a constant state of equilibrium. Instead, the aggregate expenditure and aggregate supply adjust each other toward equilibrium.
When there is excess supply over the expenditure, there is a reduction in either the prices or the quantity of the output which reduces the total output (GDP) of the economy.
In contrast, when there is an excess of expenditure over supply, there is excess demand which leads to an increase in prices or output (higher GDP). A rise in the aggregate expenditure pushes the economy towards a higher equilibrium and a higher potential of the GDP.
Aggregate Expenditure at Economic Equilibrium
An economy is said to be at equilibrium when aggregate expenditure is equal to the aggregate supply (production) in the economy.
learning objectives
- Identify the assumptions fundamental to classical economics in regards to aggregate expenditure at economic equilibrium
Aggregate Expenditure
In economics, aggregate expenditure is the current value (price) of all the finished goods and services in the economy. The equation for aggregate expenditure is \(\mathrm{AE = C+ I + G + NX}\).
Written out in full, the equation reads: aggregate expenditure = household consumption (C) + investments (I) + government spending (G) + net exports (NX).
Aggregate expenditure is a method that is used to calculate the total value of economic activities, also referred to as the gross domestic product ( GDP ). The GDP of an economy is calculated using the aggregate expenditure model.
Economic Equilibrium
An economy is said to be at equilibrium when aggregate expenditure is equal to the aggregate supply (production) in the economy. The economy is constantly shifting between excess supply (inventory) and excess demand. As a result, the economy is always moving towards an equilibrium between the aggregate expenditure and aggregate supply. On the aggregate expenditure model, equilibrium is the point where the aggregate supply and aggregate expenditure curve intersect. An increase in the expenditure by consumption (C) or investment (I) causes the aggregate expenditure to rise which pushes the economy towards a higher equilibrium.
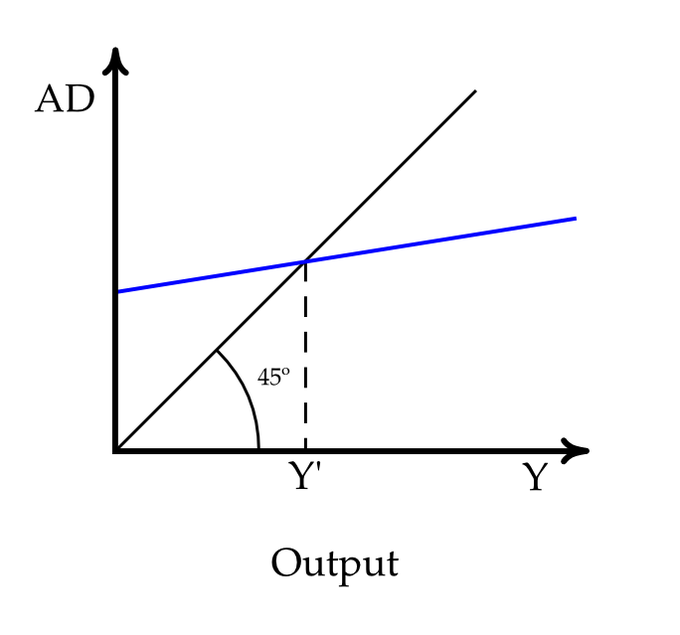
Aggregate Expenditure – Equilibrium: In this graph, equilibrium is reached when the total demand (AD) equals the total amount of output (Y). The equilibrium point is where the blue line intersects with the black line.
Classical Economics – Aggregate Expenditure
Classical economists believed in Say’s law, which states that supply creates its own demand. This idea stems from the belief that wages, prices, and interest rage were all flexible. Classical economics states that the factor payments (wage and rental payments) made during the production process create enough income in the economy to create a demand for the products that were produced. This belief is parallel to Adam Smith’s invisible hand – markets achieve equilibrium through the market forces that impact economic activity.
The classical aggregate expenditure model is: \(\mathrm{AE = C + I}\).
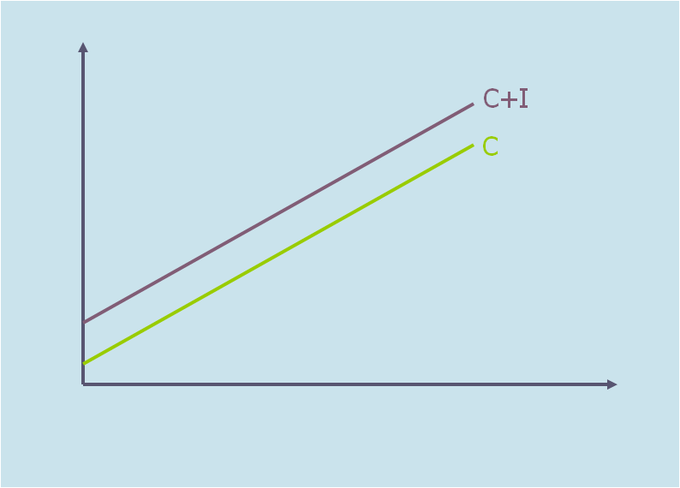
Classical Aggregate Expenditure: This graph shows the classical aggregate expenditure where C is consumption expenditure and I is aggregate investment. The aggregate expenditure is the aggregate consumption plus the planned investment (\(\mathrm{AE = C + I}\)).
The aggregate expenditure equals the aggregate consumption plus planned investment. Classical economics assumes that the economy works on a full-employment equilibrium, which is not always true. In reality, many economists argue that the economy operates at an under-employment equilibrium.
Graphing Equilibrium
An economy is said to be at equilibrium when the aggregate expenditure is equal to the aggregate supply (production) in the economy.
learning objectives
- Demonstrate how aggregate demand and aggregate supply determine output and price level by using the AD-AS model
Aggregate Supply and Aggregate Demand
In economics, the aggregate supply (AS) is the total supply of goods and services that firms in an economy produce during a specific time period. It represents the total amount of goods and services that firms are willing to sell at a given price level. The aggregate supply curve is graphed as a backwards L-shape in the short-run and vertical in the long-run.
Aggregate demand (AD) is the total demand for final goods and services in the economy at a given time and price level. It shows the amounts of goods and services that will be purchased at all the possible price levels. When aggregate demand increases its graph shifts to the right. It shifts to the left when it decreases which shows a fall in output and prices.
The aggregate supply and aggregate demand determine the output and price for goods and services. The AD-AS model is used to graph the aggregate expenditure and the point of equilibrium.

AD-AS Model: This graph shows the AD-AS model where P is the average price level and Y* is the aggregate quantity demanded. The model is used to show how increases in aggregate demand leads to increases in prices (inflation) and in output.
AD-AS Model: This graph shows the AD-AS model where P is the average price level and Y* is the aggregate quantity demanded. The model is used to show how increases in aggregate demand leads to increases in prices (inflation) and in output.
Aggregate Expenditure
Aggregate expenditure is the current value of all the finished goods and services in the economy. The equation for aggregate expenditure is: \(\mathrm{AE = C + I + G + NX}\).
The aggregate expenditure equals the sum of the household consumption (C), investments (I), government spending (G), and net exports (NX).
Graphing Equilibrium
The AD-AS model is used to graph the aggregate expenditure at the point of equilibrium. The AD-AS model includes price changes. An economy is said to be at equilibrium when the aggregate expenditure is equal to the aggregate supply (production) in the economy. It is important to note that the economy does not stay in a state of equilibrium. The aggregate expenditure and aggregate supply adjust each other towards equilibrium. When there is excess supply over expenditure, there is a reduction in the prices or the quantity or output. When there is an excess of expenditure over supply, then there is excess demand which leads to an increase in prices out output. In an effort to adjust and reach equilibrium, the economy constantly shifts between excess supply and excess demand. This shift is graphed using the AD-AS model which determines the output and price for the good or service.
The Multiplier Effect
When the fiscal multiplier exceeds one, the resulting impact on the national income is called the multiplier effect.
learning objectives
- Explain the fiscal multiplier effect
The Fiscal Multiplier and the Multiplier Effect
In economics, the fiscal multiplier is the ratio of change in the national income in relation to the change in government spending that causes it (not to be confused with the monetary multiplier). National income can change as a direct result in a change in spending whether it is private investment spending, consumer spending, government spending, or foreign export spending. When the fiscal multiplier exceeds one, the resulting impact on the national income is called the multiplier effect.
Cause of the Multiplier Effect
The multiplier is influenced by an incremental amount of spending that leads to higher consumption spending, increased income, and then even more consumption. As a result, the overall national income is greater than the initial incremental amount of spending. Simply put, an initial shift in aggregate demand may cause a change in aggregate output (as well as the aggregate income it creates) that is a multiplier of the initial change.
Use of the Multiplier Effect
The multiplier effect is a tool that is used by governments to attempt to stimulate aggregate demand in times of recession or economic uncertainty. The government invests money in order to create more jobs, which in turn will generate more spending to stimulate the economy. The goal is that the net increase in disposable income will be greater than the original investment.
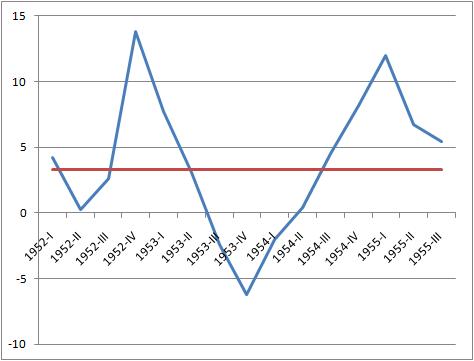
1953 U.S. Recession: This graph shows the economic recession that occurred in the U.S. in 1953. During recessions, the government can use the multiplier effect in order to stimulate the economy.
Criticisms
Although the multiplier effect usually measures values of one, there have been cases where multipliers of less than one are measured. This suggests that types of government spending can crowd out private investment or consumer spending that would have taken place without the government spending. Crowding out can occur because the initial increase in spending can cause an increase in the interest rates or the price level.
It has been argued that when a government relies heavily on fiscal multipliers, externalities such as environmental degradation, unsustainable resource depletion, and social consequences can be neglected. Over reliance on fiscal multipliers can cause increased government spending on activities that create negative externalities (pollution, climate change, and resource depletion) instead of positive externalities (increased educational standards, social cohesion, public health, etc.).
Key Points
- The aggregate expenditure is the sum of all the expenditures undertaken in the economy by the factors during a specific time period. The equation is: AE = C + I + G + NX.
- The aggregate expenditure determines the total amount that firms and households plan to spend on goods and services at each level of income.
- The aggregate expenditure is one of the methods that is used to calculate the total sum of all the economic activities in an economy, also known as the gross domestic product ( GDP ).
- When there is excess supply over the expenditure, there is a reduction in either the prices or the quantity of the output which reduces the total output (GDP) of the economy.
- When there is an excess of expenditure over supply, there is excess demand which leads to an increase in prices or output (higher GDP).
- In economics, aggregate expenditure is the current value ( price ) of all the finished goods and services in the economy. The equation for aggregate expenditure is AE = C+ I + G + NX.
- In the aggregate expenditure model, equilibrium is the point where the aggregate supply and aggregate expenditure curve intersect.
- The classical aggregate expenditure model is: AE = C + I.
- Classical economics states that the factor payments made during the production process create enough income in the economy to create a demand for the products that were produced.
Key Terms
- aggregate: A mass, assemblage, or sum of particulars; something consisting of elements but considered as a whole.
- expenditure: Act of expending or paying out.
- gross domestic product: A measure of the economic production of a particular territory in financial capital terms over a specific time period.
- equilibrium: The condition of a system in which competing influences are balanced, resulting in no net change.
- aggregate demand: The the total demand for final goods and services in the economy at a given time and price level.
- aggregate supply: The total supply of goods and services that firms in a national economy plan on selling during a specific time period.
- equilibrium: The condition of a system in which competing influences are balanced, resulting in no net change.
- multiplier effect: A factor of proportionality that measures how much an endogenous variable changes in response to a change in some exogenous variable.
- fiscal multiplier: The ratio of a change in national income to the change in government spending that causes it.
LICENSES AND ATTRIBUTIONS
CC LICENSED CONTENT, SHARED PREVIOUSLY
- Curation and Revision. Provided by: Boundless.com. License: CC BY-SA: Attribution-ShareAlike
CC LICENSED CONTENT, SPECIFIC ATTRIBUTION
- Aggregate Expenditures Model. Provided by: Wikipedia. Located at: en.Wikipedia.org/wiki/Aggrega...nditures_Model. License: CC BY-SA: Attribution-ShareAlike
- Aggregate expenditure. Provided by: Wikipedia. Located at: en.Wikipedia.org/wiki/Aggregate_expenditure. License: CC BY-SA: Attribution-ShareAlike
- expenditure. Provided by: Wiktionary. Located at: en.wiktionary.org/wiki/expenditure. License: CC BY-SA: Attribution-ShareAlike
- aggregate. Provided by: Wiktionary. Located at: en.wiktionary.org/wiki/aggregate. License: CC BY-SA: Attribution-ShareAlike
- gross domestic product. Provided by: Wiktionary. Located at: en.wiktionary.org/wiki/gross_domestic_product. License: CC BY-SA: Attribution-ShareAlike
- Keynesian cross and growth in expenditure. Provided by: Wikipedia. Located at: en.Wikipedia.org/wiki/File:Ke...xpenditure.png. License: CC BY-SA: Attribution-ShareAlike
- Aggregate expenditure. Provided by: Wikipedia. Located at: en.Wikipedia.org/wiki/Aggregate_expenditure. License: CC BY-SA: Attribution-ShareAlike
- Aggregate Expenditures Model. Provided by: Wikipedia. Located at: en.Wikipedia.org/wiki/Aggrega...nditures_Model. License: CC BY-SA: Attribution-ShareAlike
- Economic equilibrium. Provided by: Wikipedia. Located at: en.Wikipedia.org/wiki/Economic_equilibrium. License: CC BY-SA: Attribution-ShareAlike
- Aggregate expenditure. Provided by: Wikipedia. Located at: en.Wikipedia.org/wiki/Aggregate_expenditure. License: CC BY-SA: Attribution-ShareAlike
- expenditure. Provided by: Wiktionary. Located at: en.wiktionary.org/wiki/expenditure. License: CC BY-SA: Attribution-ShareAlike
- aggregate. Provided by: Wiktionary. Located at: en.wiktionary.org/wiki/aggregate. License: CC BY-SA: Attribution-ShareAlike
- equilibrium. Provided by: Wiktionary. Located at: en.wiktionary.org/wiki/equilibrium. License: CC BY-SA: Attribution-ShareAlike
- Keynesian cross and growth in expenditure. Provided by: Wikipedia. Located at: en.Wikipedia.org/wiki/File:Ke...xpenditure.png. License: CC BY-SA: Attribution-ShareAlike
- Classical aggregate expenditure. Provided by: Wikipedia. Located at: en.Wikipedia.org/wiki/File:Cl...xpenditure.png. License: CC BY-SA: Attribution-ShareAlike
- KeynesianCross 3. Provided by: Wikipedia. Located at: en.Wikipedia.org/wiki/File:Ke...ianCross_3.png. License: CC BY-SA: Attribution-ShareAlike
- Economic equilibrium. Provided by: Wikipedia. Located at: en.Wikipedia.org/wiki/Economic_equilibrium. License: CC BY-SA: Attribution-ShareAlike
- Aggregate demand. Provided by: Wikipedia. Located at: en.Wikipedia.org/wiki/Aggregate_demand. License: CC BY-SA: Attribution-ShareAlike
- Aggregate Expenditures Model. Provided by: Wikipedia. Located at: en.Wikipedia.org/wiki/Aggrega...nditures_Model. License: CC BY-SA: Attribution-ShareAlike
- Aggregate supply. Provided by: Wikipedia. Located at: en.Wikipedia.org/wiki/Aggregate_supply. License: CC BY-SA: Attribution-ShareAlike
- Aggregate expenditure. Provided by: Wikipedia. Located at: en.Wikipedia.org/wiki/Aggregate_expenditure. License: CC BY-SA: Attribution-ShareAlike
- aggregate supply. Provided by: Wikipedia. Located at: en.Wikipedia.org/wiki/aggregate%20supply. License: CC BY-SA: Attribution-ShareAlike
- aggregate demand. Provided by: Wikipedia. Located at: en.Wikipedia.org/wiki/aggregate%20demand. License: CC BY-SA: Attribution-ShareAlike
- equilibrium. Provided by: Wiktionary. Located at: en.wiktionary.org/wiki/equilibrium. License: CC BY-SA: Attribution-ShareAlike
- Keynesian cross and growth in expenditure. Provided by: Wikipedia. Located at: en.Wikipedia.org/wiki/File:Ke...xpenditure.png. License: CC BY-SA: Attribution-ShareAlike
- Classical aggregate expenditure. Provided by: Wikipedia. Located at: en.Wikipedia.org/wiki/File:Cl...xpenditure.png. License: CC BY-SA: Attribution-ShareAlike
- KeynesianCross 3. Provided by: Wikipedia. Located at: en.Wikipedia.org/wiki/File:Ke...ianCross_3.png. License: CC BY-SA: Attribution-ShareAlike
- AS AD graph. Provided by: Wikipedia. Located at: en.Wikipedia.org/wiki/File:AS_+_AD_graph.svg. License: CC BY-SA: Attribution-ShareAlike
- Multiplier Effect. Provided by: Wikipedia. Located at: en.Wikipedia.org/wiki/Multiplier_Effect. License: CC BY-SA: Attribution-ShareAlike
- fiscal multiplier. Provided by: Wikipedia. Located at: en.Wikipedia.org/wiki/fiscal%20multiplier. License: CC BY-SA: Attribution-ShareAlike
- multiplier effect. Provided by: Wikipedia. Located at: en.Wikipedia.org/wiki/multiplier%20effect. License: CC BY-SA: Attribution-ShareAlike
- Keynesian cross and growth in expenditure. Provided by: Wikipedia. Located at: en.Wikipedia.org/wiki/File:Ke...xpenditure.png. License: CC BY-SA: Attribution-ShareAlike
- Classical aggregate expenditure. Provided by: Wikipedia. Located at: en.Wikipedia.org/wiki/File:Cl...xpenditure.png. License: CC BY-SA: Attribution-ShareAlike
- KeynesianCross 3. Provided by: Wikipedia. Located at: en.Wikipedia.org/wiki/File:Ke...ianCross_3.png. License: CC BY-SA: Attribution-ShareAlike
- AS AD graph. Provided by: Wikipedia. Located at: en.Wikipedia.org/wiki/File:AS_+_AD_graph.svg. License: CC BY-SA: Attribution-ShareAlike
- 1953 recession in US. Provided by: Wikimedia. Located at: commons.wikimedia.org/wiki/Fi...sion_in_US.jpg. License: Public Domain: No Known Copyright

