How are individual demands and supplies aggregated to create a market?
Individuals with their own supply or demand trade in a market, where prices are determined. Markets can be specific or virtual locations—the farmers’ market, the New York Stock Exchange, eBay—or may be an informal or more amorphous market, such as the market for restaurant meals in Billings, Montana, or the market for roof repair in Schenectady, New York.
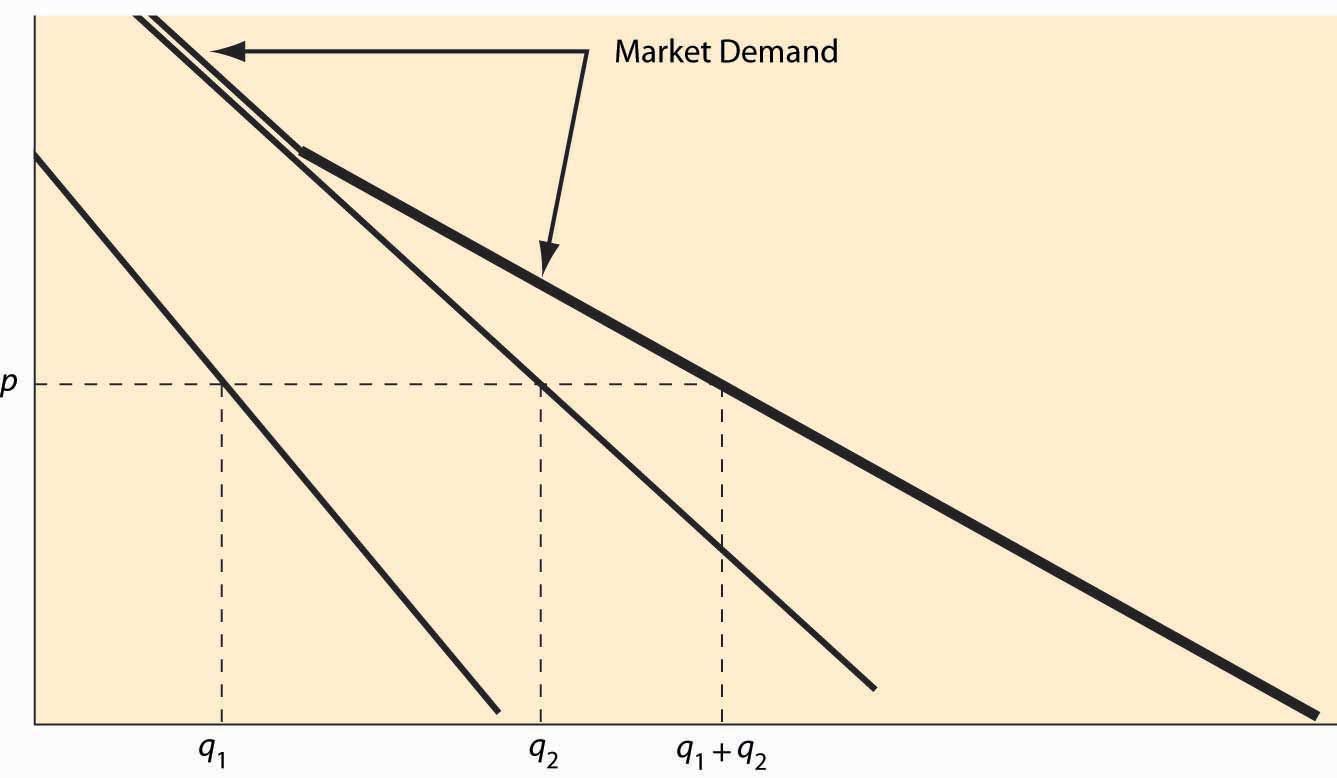
Figure 2.7 Market demand
Figure 2.7. For a given price p, the quantity q1 demanded by one consumer and the quantity q2 demanded by a second consumer are illustrated. The sum of these quantities represents the market demand if the market has just those two participants. Since the consumer with subscript 2 has a positive quantity demanded for high prices, while the consumer with subscript 1 does not, the market demand coincides with consumer 2’s demand when the price is sufficiently high. As the price falls, consumer 1 begins purchasing, and the market quantity demanded is larger than either individual participant’s quantity and is the sum of the two quantities.
Example: If the demand of Buyer 1 is given by \(\begin{equation}q = max {0, 10 – p}\end{equation}\), and the demand of Buyer 2 is given by \(\begin{equation}q = max {0, 20 – 4p}\end{equation}\), what is market demand for the two participants?
Solution: First, note that Buyer 1 buys zero at a price of 10 or higher, while Buyer 2 buys zero at a price of 5 or higher. For a price above 10, market demand is zero. For a price between 5 and 10, market demand is Buyer 1’s demand, or \(\begin{equation}10 – p\end{equation}\). Finally, for a price between zero and 5, the market quantity demanded is \(\begin{equation}10 – p + 20 – 4p = 30 – 5p\end{equation}\).
Market supply is similarly constructed—the market supply is the horizontal (quantity) sum of all the individual supply curves.
Example: If the supply of Firm 1 is given by \(\begin{equation}q = 2p\end{equation}\), and the supply of Firm 2 is given by \(\begin{equation}q = max {0, 5p – 10}\end{equation}\), what is market supply for the two participants?
Solution: First, note that Firm 1 is in the market at any price, but Firm 2 is in the market only if price exceeds 2. Thus, for a price between zero and 2, market supply is Firm 1’s supply, or 2p. For \(\begin{equation}p > 2\end{equation}\), market supply is \(\begin{equation}5p – 10 + 2p = 7p – 10.\end{equation}\)
Key Takeaways
The market demand gives the quantity purchased by all the market participants—the sum of the individual demands—for each price. This is sometimes called a “horizontal sum” because the summation is over the quantities for each price.
The market supply is the horizontal (quantity) sum of all the individual supply curves.
EXERCISES
Is the consumer surplus for market demand the sum of the consumer surpluses for the individual demands? Why or why not? Illustrate your conclusion with a figure like Figure 2.7.
Suppose the supply of firm i is αi p, when the price is p, where i takes on the values \(\begin{equation}1, 2, 3, …, n\end{equation}\). What is the market supply of these n firms?
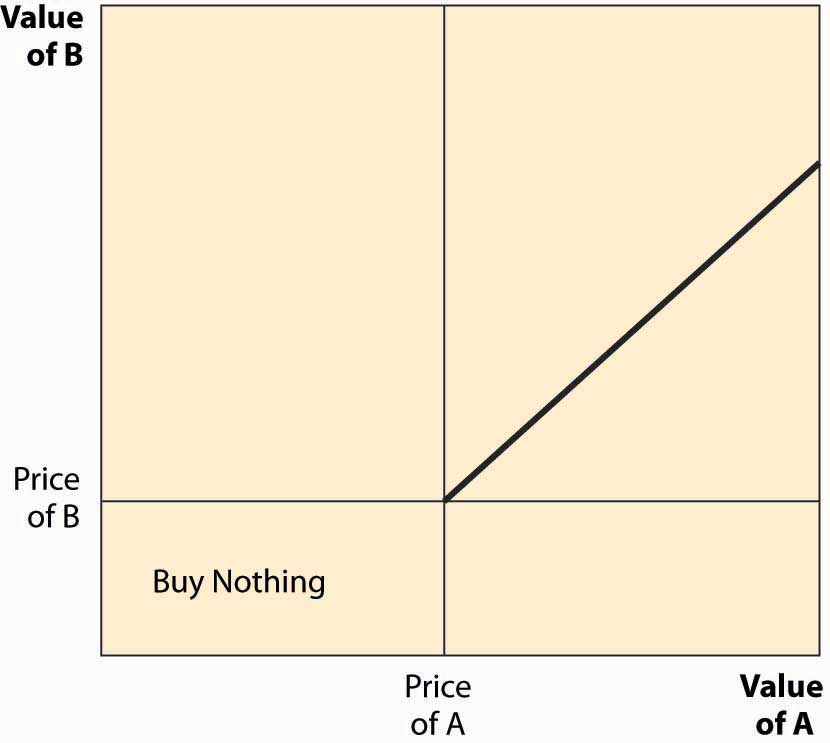
Suppose consumers in a small town choose between two restaurants, A and B. Each consumer has a value vA for A’s meal and a value vB for B’s meal, and each value is a uniform random draw from the [0, 1] interval. Consumers buy whichever product offers the higher consumer surplus. The price of B’s meal is 0.2. In the square associated with the possible value types, identify which consumers buy from A. Find the demand, which is the area of the set of consumers who buy from A in the diagram below. [Hint: Consumers have three choices—buy nothing [value 0], buy from A [value vA – pA], and buy from B [value vB – pB = vB – 0.2).] Draw the lines illustrating which choice has the highest value for the consumer.