
2: What is a Good Society?
- Last updated
- Save as PDF
- Page ID
- 46250

Goals and Objectives:
In this chapter, we will do the following:
- Describe different perspectives of what constitutes a good society
- Define the economic problem as understood within neoclassical economics
- Identify the key prerequisites of economic efficiency in neoclassical economics
- Analyze the production possibilities model of neoclassical economics
- Develop two essential measures of opportunity cost that neoclassical economists use
- Explain how economic efficiency is represented in the production possibilities model
- Apply the production possibilities model to a number of different situations
- Build a classification scheme for different economic systems
Competing Perspectives of What Constitutes a Good Society
The question of what constitutes a good society is one that has been discussed and debated for thousands of years. Many different answers have been offered, and no single answer is universally recognized as the best answer. The question was of interest in Ancient Greece. In The Republic, Plato described what he regarded to be the ideal society. Plato’s ideal society was hardly a democracy. In fact, it contained a strict social hierarchy. For Plato, the best society was one in which the philosopher-kings ruled. This structure worked out well for Plato since he was a philosopher himself! The reason Plato regarded this feature to be an essential one in his ideal society is that philosophers were the wisest members of society. As a result, only they could be trusted to make decisions that would best serve the population. This class-based society also included a warrior class and a class of slaves, leading many to reject this notion of the ideal society.
Sir Thomas More offered another perspective on the question in the sixteenth century with the publication of his book Utopia. More approached the question from a Christian perspective in this famous work. In Utopia, More describes a fictional island named Utopia that is an ideal one from his perspective. The island of Utopia consists of several cities spread out across the island. The Utopians rotate living in the city and in the countryside. Their economy is based on communally owned property and the free distribution of necessities. They also have a short, six-hour workday and the least pleasant work is performed by slaves. The slaves are mostly criminals and prisoners of war. Freed from the toil of work, the Utopians were free most of the day to enjoy socializing with one another and learning about new subjects.
Mohandas Gandhi, the leader of the independence movement in India during the twentieth century, had a different perspective on what constitutes a good society. Gandhi advocated economic self-sufficiency, protectionism for local economies, and the avoidance of materialism.[1] The emphasis on local production and the resistance to long-distance trade in Gandhi’s economic philosophy stem from the British legacy of colonialism in India. In the nineteenth century, a flood of British imports of cheap cloth helped bring about a rapid decline of the Indian textile industry. To this day, Indians have serious concerns about the possible consequences of unrestricted imports for domestic producers. An avoidance of materialism and excess consumption stems from a belief that spiritual values would suffer from an excessive devotion to the acquisition of material wealth. Gandhi also emphasized elevating the worst-off members of society in the pursuit of greater equality and a sense of brotherhood.[2]
Islamic economists hold a different vision of what constitutes a good society. Muslims believe that in the seventh century, God spoke to the Prophet Mohammad through the angel Gabriel.[3] These revelations were subsequently recorded in the Quran, and Mohammad’s other declarations are documented in the Hadith.[4] These texts form the basis of the Islamic law code.[5] According to Islamic economists then, the ideal society is one that adheres strictly to Islamic law as set forth in the Quran and the Hadith. Whereas western nations abide by the principle of the strict separation of church and state, Islamic nations often have governments in which church and state are merged. These theocratic governments have the power to enforce compliance with Islamic law. Key features of Islamic economics include profit-sharing but a prohibition on the payment of interest, proper consumption that excludes the consumption of alcohol and pork, a wealth tax for redistribution to the poor, the avoidance of uncertainty (e.g., gambling), and a belief in universal brotherhood.[6]
Another thinker who advocated an ideal society in the nineteenth century was Karl Marx. Marx’s advocacy of socialism (and ultimately communism) is somewhat unusual in that he did not specify with much precision how these superior societies were supposed to work. Instead, he concentrated his attention on the exploitative nature of market capitalism with the belief that his critique would ultimately lead to a revolutionary socialist transformation of human society. In Marx’s theory, the capitalist class (the bourgeoisie) exploits the working class (the proletariat) within capitalist societies. According to Marx, the working class will eventually establish a society in which working people own the means of production in common and all class distinctions are abolished. Although Marx’s description of the future socialist society is incomplete, he argued that workers would be compensated according to their work and would contribute to production as they are able. In the later communist society, workers would be compensated according to their need and would contribute to production as they are able.
The novelist and philosopher Ayn Rand is another thinker who offered a vision of the ideal society in the twentieth century. According to Rand, capitalism is the ideal society, as it is the only society, in her opinion, that protects human rights. For Rand, human rights are not granted by God, or society, or the state. Rather, rights derive from the very nature of human beings. These rights include the right to life and the right to property. That is, each individual human being has a right to do with his or her life or property whatever he or she wishes, provided he or she does not interfere with anyone else’s rights. Therefore, no one has the right to take another person’s life or property without first obtaining that person’s consent. For that reason, the voluntary exchange of property is the only kind of transaction that respects the right to property. Market capitalism is thus the ideal society in Rand’s view. Furthermore, the state has one function only and that is to protect the individual rights to life and property. If the state acts in a way that violates these rights, then it acts immorally.[7]
Alongside all these competing perspectives of the ideal society is the neoclassical perspective that the ideal society is the one that achieves efficiency. Simply put, the ideal society is the one that obtains the most advantages with the least use of resources. It may also be thought of as the avoidance of all waste. In the next section, we begin to explore the neoclassical concept of efficiency. As the reader will soon discover, neoclassical economists have a more complicated definition of efficiency than the brief definition offered in this section. Nevertheless, it should be clear that neoclassical economists possess their own concept of the good society.
The Economic Problem and the Scarcity of Resources
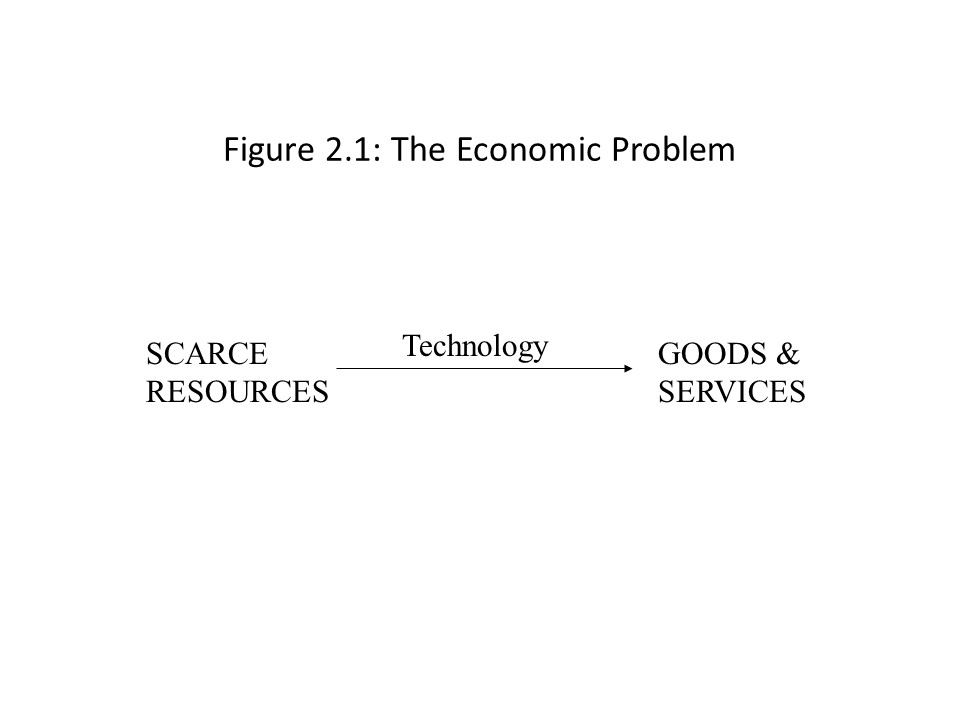
According to neoclassical economists, all human societies face the same basic problem, regardless of whether we are discussing a primitive tribal community or a modern, highly advanced industrialized economy. The economic problem, as it is called, may be stated as follows:
- How can society best transform scarce and limited economic resources with its given state of technology into goods and services in the presence of unlimited and insatiable human wants?[8]
Figure 2.1 connects the key components of the economic problem.
At first glance, it might appear that the situation is entirely hopeless. The reason is that the resources used for production are limited and yet human wants are claimed to be limitless. It is, therefore, impossible to completely solve the economic problem. An infinite amount of production would be necessary to satisfy unlimited wants and that is simply impossible. It may be clear now why neoclassical economics is regarded as the dismal science. It begins with a problem facing all of humanity that can never be solved! What is the ideal society then if all societies confront this insoluble problem?
Before we investigate this issue further, it will be helpful to explore what neoclassical economists mean when they refer to resources. Resources, also referred to as factors of production or inputs, are classified into three different categories: land, labor, and capital. Land (T) refers to natural resources. That is, land includes all elements of production that are not previously passed through some production process, such as rivers, forests, and minerals that have not yet been extracted. Capital (K) is understood by neoclassical economists to mean something very different from what businesspeople often mean when they refer to capital. Businesspeople often have in mind a sum of money that is used to start a business. Occasionally, economists refer to financial capital when they wish to use the meaning that businesspeople assign to capital. Because economists are primarily interested in physical resources, however, they define capital as physical goods. Specifically, when neoclassical economists refer to capital, they have in mind goods that are used to produce other goods, including machinery, tools, and production plants. Similarly, the neoclassical use of the term investment (I) is rather different from the way the term is used in the financial services industry. Instead of referring to financial investments in stocks and bonds, neoclassical economists have in mind the growth of capital through time by means of production or purchase.
At this stage, it will be helpful to distinguish between two types of variables: stock variables and flow variables. A stock variable is a variable that is measured as of a point in time. A flow variable, on the other hand, is a variable that is measured per unit of time. For example, a household’s wealth is a stock variable. That is, as of this moment, the household’s total assets minus its debts can be measured in dollar terms (e.g., $250,000). The income of the household, on the other hand, is a flow variable. Household income can be measured in dollar terms, but the period must be specified. For example, it is not helpful to state that household income is $75,000. Is the income level $75,000 per year, per month, or per week? Similarly, capital is a stock variable, and investment is a flow variable. The capital stock may be 500 factories, but the amount of investment may be 15 factories per year.
Finally, labor (L) refers to the work that individuals perform. It may be measured as a stock variable or as a flow variable. For example, the size of the labor force might be measured in terms of the number of individual workers available for work at this moment, in which case it would be measured as a stock variable. On the other hand, it might be measured in terms of hours of employment each year, in which case it would be measured as a flow variable. Depending on the problem being considered, it may make sense to measure labor as a stock variable or as a flow variable. To avoid errors, it is important to know which type of variable has been chosen for the measurement of labor, capital, or land. Furthermore, regardless of how these variables are measured, it is crucial to remember that they are always regarded as scarce.
It should also be mentioned briefly that technology here means nothing more than the methods or techniques that are used to transform economic resources into goods and services. At a point in time, the knowledge of different production techniques is given or fixed. It is, therefore, an additional constraint that gives rise to the economic problem.
The Neoclassical Ideal: Economic Efficiency
It is now possible to consider what neoclassical economists consider to be the ideal society. The ideal society is one that achieves economic efficiency. The concept of economic efficiency in neoclassical theory has three key components. If any one of these three components is missing, then economic efficiency is not being achieved. First, the full employment of all resources must be achieved. That is, all land, labor, and capital must be fully used for production. Granted, it is necessary to consider efficiency in the use of resources over time. For example, if we use all our natural resources this year, then we will have nothing left in future years. As a result, it is necessary to distinguish between static efficiency, which refers to efficiency in the present moment, versus dynamic efficiency, which refers to efficiency over time. Although questions of sustainability are very important, our focus will be only on static efficiency in this chapter. That is, given the amount of resources our society has available in the present period, if all these resources are employed then full employment is achieved.
The second requirement for economic efficiency is productive efficiency, which refers to the least-cost or cost-minimizing method of production. It is possible that all resources are fully employed but not in the least cost manner. For example, suppose that for one day the heart surgeons trade places with the professional basketball players. Everyone continues to be fully employed but now they are employed in a way that is rather costly. The heart surgeries that take place that day will have a very high cost indeed, and the basketball games will probably not be especially well played.
The third requirement for economic efficiency is allocative efficiency, which refers to the most desirable mix of goods. That is, it is possible that all resources are fully employed and in the least-cost way but that the goods that are produced are not at all what people want to consume. For example, suppose that all that is produced in the economy is silly string. Everyone may have a job, but consumers will have no food, housing, or clothing to consume.
To sum up, for an economy to achieve economic efficiency, it must fully employ its resources in the least-cost manner and produce the combination of goods and services that consumers most desire. That is, full employment, productive efficiency, and allocative efficiency must all be achieved. The reader should note that an economy that achieves economic efficiency does not solve the economic problem. Instead, an economically efficient economy does the best that it possibly can in the face of the insoluble economic problem. The economically efficient economy is, therefore, the ideal society according to neoclassical economists. It is natural to ask which form of society will achieve this ideal outcome. We will return to this question towards the end of this chapter. In the next section, we will see how the different components of economic efficiency may be represented in an economic model.
The Production Possibilities Model
In this section, we will consider how to represent the economic problem within the context of an economic model called the production possibilities model. The model is a graphical depiction of the economic problem confronting any form of society. That is, because the economic problem is one that all societies face, this model is a completely general one in the sense that nothing is assumed about the type of economic system to which it applies. As with all economic models, it is necessary to identify the assumptions of the model. The model has several assumptions. It is assumed that the society only produces two goods, and they are measured in physical terms. The first assumption that the goods are measured in physical terms is significant because it is consistent with the notion that the model may apply to any form of society. Strictly speaking, the goods should not be measured in monetary terms because the economy being considered many not have money at all. It may be a barter economy or have some other mechanism of resource allocation and product distribution.
It is also assumed that the society possesses fixed stocks of land, labor, and capital, and a fixed production technology. The second and third assumptions that the resource stocks and production technology are given are central to the neoclassical entry point. Finally, it is assumed that the society is currently achieving full employment and productive efficiency. The assumption of full employment and productive efficiency is one requirement short of economic efficiency. That is, allocative efficiency is not assumed, and so at this stage, no assumptions are made about what society regards as the most desirable combination of goods. After the model is more developed, societal preferences will be introduced.[9]
Figure 2.2 shows an example of a production possibilities schedule with a corresponding production possibilities frontier (PPF).
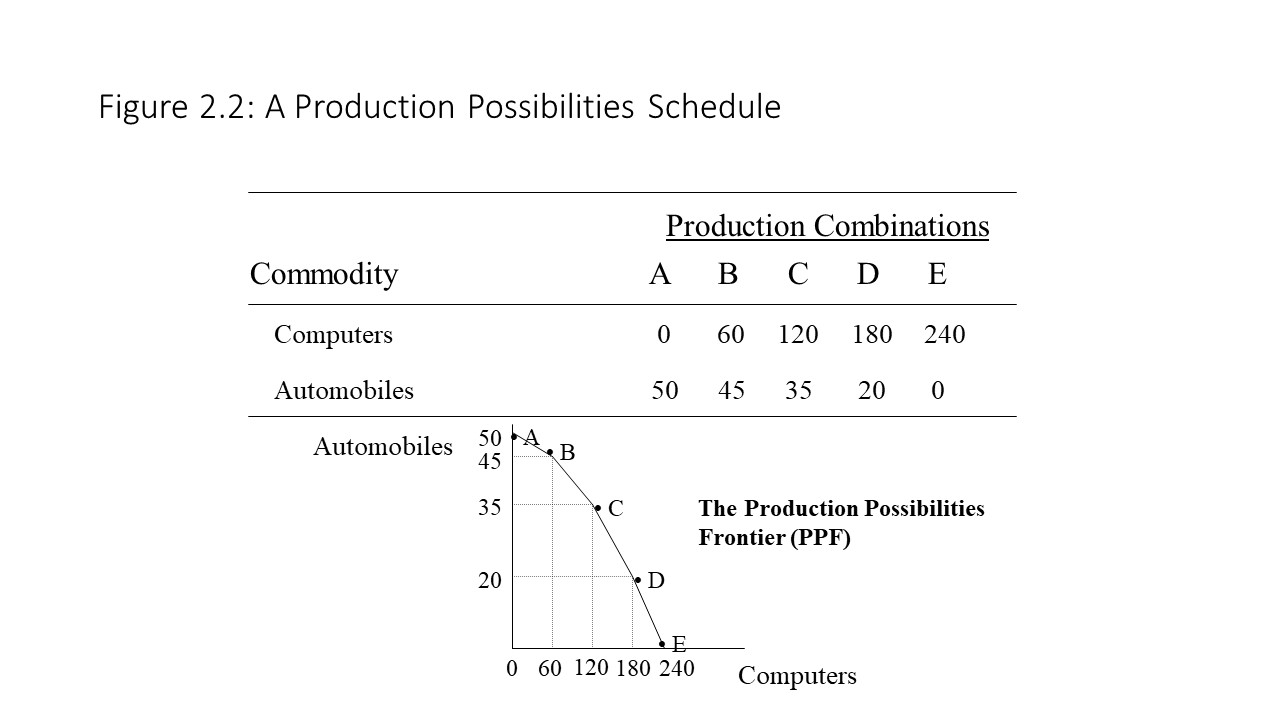
The table may be understood in the following way. A society may choose between production combination A, B, C, D, or E at any given time. For each production combination that it might choose, the society is able to produce the corresponding combination of computers and automobiles. For example, if society chooses production combination A, then it can produce both 0 computers and 50 automobiles. If it chooses production combination B, then it can produce both 60 computers and 45 automobiles, and so on. When each of these production combinations is plotted on a two-dimensional graph, a line can be drawn that connects them. This line is referred to as the production possibilities frontier (PPF). By assumption, each point on the PPF represents a combination of automobiles and computers that fully employs society’s resources using the least-cost method of production (i.e., the best available production technology).
The production possibilities model teaches us two important lessons. The first lesson is that all societies face tradeoffs. One can easily observe from looking at the table in Figure 2.2 that an increase in the production of one of the goods necessarily leads to a reduction in the production of another good. Similarly, the negative slope of the PPF also indicates that society faces tradeoffs. As society moves along the curve from one production combination to another, a rise in the production of one good is only achieved due to a reduction in the production of another good. Another way of stating that all societies face tradeoffs is to state that all societies incur opportunity costs. The opportunity cost of an option X is the next best alternative Y that must be sacrificed to obtain X. Individuals incur opportunity costs all the time. The reader has chosen to read this book rather than take a nap, which might be the next best alternative. The opportunity cost of reading the book is the nap that cannot be taken. Similarly, societies incur opportunity costs. If society desires more computers, then it can only obtain additional computers by sacrificing the production of a certain number of automobiles. Due to full employment and productive efficiency, it is only possible to increase computer production by shifting resources away from the production of automobiles and towards computers. The loss of resources in the automobile sector is the reason that automobile production declines.
The second lesson that we learn from the production possibilities model is that all societies face increasing opportunity costs. That is, the opportunity cost of producing an additional unit of a good rises as more of it is produced. To really understand this concept, it is necessary to have a way of measuring opportunity cost. Otherwise, it does not make much sense to claim that opportunity costs are increasing. We have two ways of measuring opportunity cost.[10] The first way of measuring opportunity cost involves the use of something called total opportunity cost. The best way to understand total opportunity cost is to consider an example. Using the table from Figure 2.2, the reader will observe that if society produces 120 computers, then the entire amount of automobile production lost is 15 automobiles. That is, automobile production falls from 50 automobiles to 35 automobiles. In this case, the total opportunity cost of producing 120 computers is 15 automobiles. The reader should notice that the opportunity cost of a given amount of production of one good is always stated in terms of the other good that is lost. To consider a similar example, the total opportunity cost of 45 automobiles is 180 computers (because computer production falls from 240 to 60).
A second way of measuring opportunity cost, referred to as marginal opportunity cost, requires that we only look at small or marginal changes in the production of one good and the subsequent impact on the production of another good. For example, using the information from the table in Figure 2.2, we observe that an increase in computer production from 60 to 120 computers leads to a reduction in automobile production from 45 to 35 automobiles. That is, the marginal opportunity cost of the additional 60 computers is 10 automobiles. To consider a similar example, the marginal opportunity cost of increasing automobile production from 20 to 35 is 60 computers (because computer production falls from 180 to 120 computers).
When confronted with discrete as opposed to continuous data, it is sometimes necessary to calculate marginal opportunity cost using an approximation. For example, if we are interested in calculating the marginal opportunity cost of the 60th computer, then we do not have the information available in the table to answer the question with perfect precision. That is, we would need to see the movement from 59 to 60 computers and observe what happens to automobile production over this limited range. To approximate the marginal opportunity cost in this case, we will use the next lowest number in the table and divide the corresponding change in automobiles by the change in computer production as follows:
According to this calculation, the marginal opportunity cost of the 60th computer is approximately 1/12 of an automobile. The perceptive reader might notice that ΔA/ΔC is also the slope of the PPF. The negative sign in our calculation indicates that the slope of the PPF is negative, which again implies that additional computer production has an opportunity cost (i.e., it leads to a loss of automobile production).
Now consider another example in which we attempt to calculate the marginal opportunity cost of producing the 120th computer. Again, we lack the information about how automobile production is affected when society increases production from 119 computers to 120 computers. Therefore, we use the next lowest number available, which in this case happens to be 60 computers. As before, we approximate the marginal opportunity cost as follows:
Again, we observe that additional computer production carries an opportunity cost. However, we notice in this case that the opportunity cost has increased from 1/12 of an automobile to 1/6 of an automobile. That is, the marginal opportunity cost is increasing, which the reader will recall is the second lesson that we learn from the production possibilities model. Because neoclassical economists argue that all human societies experience the phenomenon of increasing marginal opportunity cost, they elevate it to the status of an economic law, which they call the law of increasing opportunity cost. Because the marginal opportunity cost is measured using the slope of the PPF, we can easily observe the operation of this law by noting how the slope becomes steeper (and thus the opportunity cost greater) as society moves along the PPF.
Of course, the reader might wonder why all human societies experience this phenomenon. After all, the numbers were simply assumed. They were not gathered during an empirical analysis of an actual economy. Why then do neoclassical economists regard it as self-evident that all human societies will experience this phenomenon? The reason relates to the underlying resources used in the production of the two goods. In general, societies possess heterogeneous resources. That is, among the resources societies use, some of the resources are better suited to the production of one good and other resources are better suited to the production of another good. If all resources were equally suited to the production of all goods, then society would possess homogenous resources. Because heterogeneous resources are the general rule, however, neoclassical economists assert that all human societies experience the phenomenon of increasing marginal opportunity cost.
To understand why the presence of heterogeneous resources leads to increasing opportunity cost, consider what happens when society begins at production combination A with 0 computers and 50 automobiles. As our society shifts resources from the automobile sector to the computer sector, computer production rises and automobile production falls. Notice, however, that automobile production only falls by 5 units when society moves to production combination B. The reason is that the first resources to be shifted to computer production will be the resources that are best suited to the production of computers and those that are least suited to the production of automobiles. When society moves to production combination C, computer production increases by 60 units again, but this time automobile production falls by 10 units. The reason for the larger decline in automobile production is that the resources shifted are now better suited to automobile production (and less suited to computer production) than those shifted previously. As a result, automobile production must fall by a larger amount to obtain the same rise in computer production that occurred previously. This pattern continues until automobile production must fall by a full 20 units (in the move from production combination D to E) to obtain a 60 unit rise in computer production. At this point, the best automobile resources must be shifted to computer production to obtain the 60 unit rise in computer production. It is the heterogeneity of the resource base that generates the pattern of rising marginal opportunity cost.
It should be noted that we could also approximate the marginal opportunity cost of an additional automobile in a similar manner. For example, if we wish to calculate the marginal opportunity cost of the 45th automobile, then we lack the information in the table that would allow us to calculate the answer exactly (i.e., the movement from 44 to 45 automobiles with the corresponding reduction in computer production). As a result, we can approximate the marginal opportunity cost of the 45th automobile as follows:
Again, the negative sign indicates that additional automobile production carries an opportunity cost (i.e., lost computer production). The reader should notice, however, that ΔC/ΔA is the reciprocal of the slope of the PPF rather than the slope itself. Depending on which good we are considering, the marginal opportunity cost may be approximated using the slope or the reciprocal of the slope of the PPF. The important point to remember is that the other good is always placed in the numerator when carrying out this approximation. The reason the other good is placed in the numerator is that opportunity cost is always measured in terms of the lost amount of the other good and never in terms of the same good.
Sometimes the phenomenon of increasing marginal opportunity cost is described in terms of the law of diminishing returns. For example, consider the situation in Figure 2.2 where the society begins with 240 computers and 0 automobiles. As computer production declines in increments of 60 computers, the increases in automobile production become smaller and smaller. Society can boost automobile production a great deal initially, but the more it devotes land, labor, and capital to the production of automobiles, the more difficult it is to increase automobile production.
The Role of Societal Preferences in the Production Possibilities Model
Now that we have learned the two most important insights of the production possibilities model, we need to consider how economic efficiency is represented in the model. Because full employment and productive efficiency were assumed at the outset, any point on the PPF must satisfy these two conditions of economic efficiency. For society to achieve economic efficiency, however, allocative efficiency is another requirement that must be met. The reader will recall that for society to achieve allocative efficiency, the most desirable mix of goods must be produced. But what is the most desirable mix of goods for all members of society? We all have very different preferences and so sorting out what society’s preferences are will not be an easy task.[11]
We can begin to think about how neoclassical economists address this question by dropping our earlier assumption that money values do not exist in this economy. If we consider an economy in which goods and resources have monetary values, then we can use something called cost-benefit analysis to determine the most desirable mix of goods for a given society.[12] Figure 2.3 shows how this analysis may be carried out using the computer industry from our previous example.
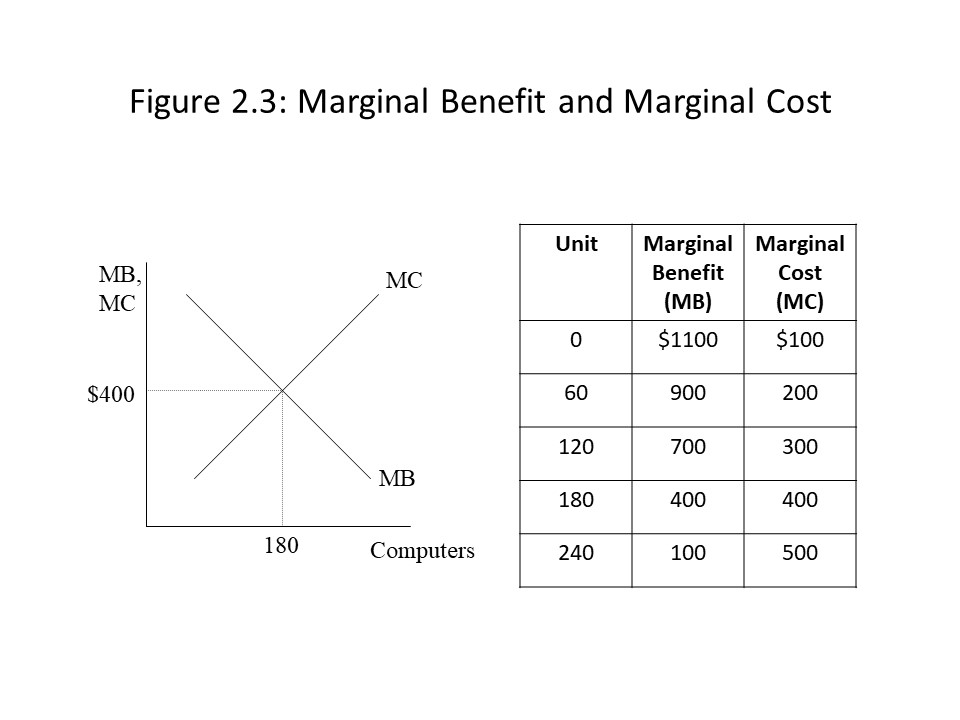 In Figure 2.3, it should be clear that as computer production rises, the marginal opportunity cost of production (here measured in dollar terms) increases. This increase in marginal cost (MC) is consistent with the law of increasing opportunity cost discussed previously. In addition, a new concept is introduced that we will refer to as marginal benefit (MB). The marginal benefit of a specific unit of a good represents the maximum dollar amount that members of society are willing to pay for that unit. In this case, when zero computers are produced, someone in society is willing to pay as much as $1100 for the first computer. By the time 60 computers are produced, the maximum amount someone is willing to pay is $900. The reason for the decline in marginal benefit is intuitive. As people consume more of a good, they experience less and less additional benefit from its consumption. Eventually, the marginal benefit of an additional unit declines to $100 once 240 computers are produced. What we observe in the table and the graph then are the diminishing marginal benefit of consumption and the increasing marginal cost of production.
When using cost-benefit analysis to determine the most desirable quantity of a good, it is only necessary to compare marginal benefit and marginal cost at each step. For example, when zero computers are produced, someone in society is willing to pay $1100 for the first computer, but the marginal cost to society is only $100. The production of the first computer clearly represents a net gain to society, and cost-benefit analysis indicates that it should be produced. When 60 computers are produced, a net gain to society exists from the production of another unit because the marginal benefit is $900 and the marginal cost is $200. The same holds true when 120 computers are produced. In that case, the marginal benefit of $700 exceeds the marginal cost of $300. It should be clear, however, that the net marginal gain (= marginal benefit minus marginal cost) is declining as more computers are produced. The marginal cost is rising due to the presence of heterogeneous resources, and the marginal benefit is declining as the population experiences a reduction in satisfaction from each additional unit consumed. Eventually, society reaches the point where marginal benefit and marginal cost are equal and net marginal gain is zero. When 180 computers are produced, the marginal benefit to society of an additional computer is $400, and this amount is exactly equal to the marginal cost of $400. In a sense, society just breaks even at this level of computer production. Although the net marginal gain of producing another computer is zero in this case, the computer can be produced without generating an inefficient outcome. Any additional production, however, will undermine economic efficiency. For example, if society produces 240 computers, then the marginal cost of $500 will exceed the marginal benefit of $100.
The general rule may be stated as follows. Society should produce a good up to the point where the marginal benefit of the last unit consumed equals the marginal cost of the last unit produced. If the marginal benefit exceeds the marginal cost of production, then society should produce more of the good. If the marginal benefit is below the marginal cost of production, then society should produce less of the good. Once the point is reached where marginal benefit equals marginal cost, then the allocatively efficient quantity of the good is being produced. This point occurs at the intersection of the MB and MC lines in the graph on the right in Figure 2.4.
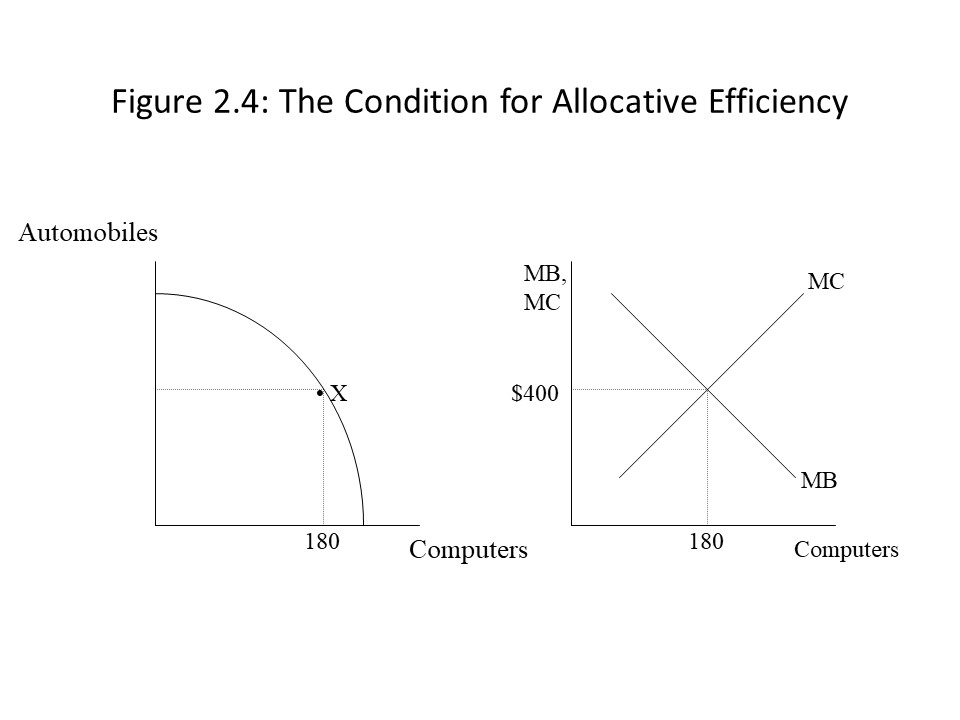 We can then identify in the graph on the left this quantity of computers. It is necessary to carry out a similar cost-benefit analysis for all goods produced in the economy. When all goods are produced such that marginal benefit equals marginal cost, then society has achieved economic efficiency. That is, society is not only producing on the PPF, indicating full employment and productive efficiency, it is also producing at the optimal (or best) point on the PPF from the standpoint of societal preferences, accounting for production costs. Again, we might return to the question of which form of society will bring about this result? Once again, the reader is asked to wait until the end of the chapter for the neoclassical answer to this question.
Relaxing the Assumptions of the Model
Up until now, we have continued to maintain the basic assumptions of the model. It is possible to relax these assumptions, however, and allow other variables to change. This violation of the ceteris paribus assumption is a useful way of understanding the role that the assumptions play. It also opens the door to applications of the model to historical and current events.
Let’s begin by considering the assumption of full employment of resources. Suppose the economy is initially at point W in the graph on the left in Figure 2.5.
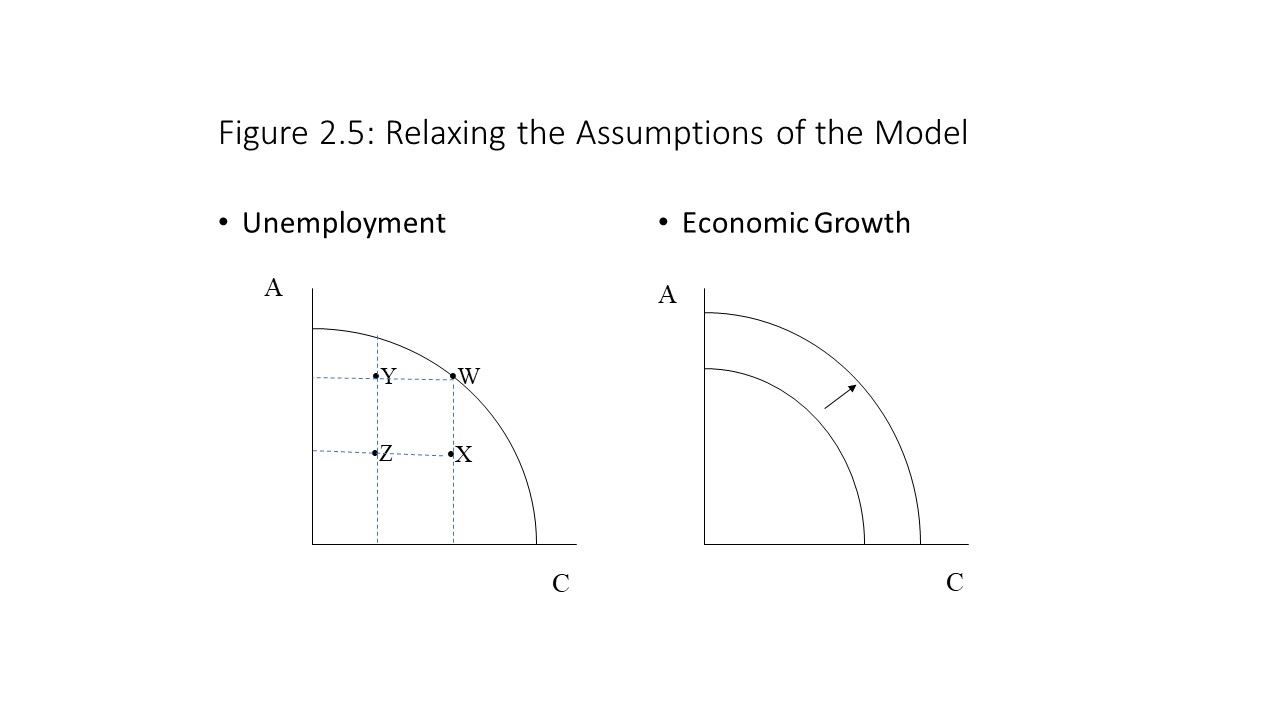
At point W, all resources are fully employed. Now suppose that some resources in the automobile sector become unemployed. Even though computer production will not be affected, automobile production will decline. This kind of change is reflected in the movement from point W to point X. Similarly, suppose that we begin at point W, but then resources in the computer industry become unemployed. Automobile production will not be affected, but computer production will decline. A change of this kind is reflected in the movement from point W to point Y. Finally, suppose that resources become unemployed in both sectors simultaneously. In that case, we would expect to see reductions in the production of both goods as reflected in the movement from point W to point Z.
The important point to notice here is that the economy moves inside its PPF when resources become unemployed. The PPF, however, does not move. The reason the PPF remains in the same place is that the resources to produce goods and services still exist. Hence, production combinations on the PPF are still possible. These production combinations are not produced, however, because some of the existing resources are idle.
It is also worth pointing out that the economy can move inside the PPF in a similar manner for a very different reason. Suppose that all resources are fully employed at point W, but then the automobile industry fails to use the least-cost method of production in that industry. In that case, the cost-minimizing production technology still exists, but it is not being used. As a result, automobile production declines below the maximum amount possible for that level of computer production, and the economy moves from point W to point X. Notice that resources are still fully employed at point X in this example. The reader should consider how similar failures to use the least-cost methods of production may lead to movements from point W to points Y or Z. Finally, such movements inside the PPF may involve a combination of the failure to fully employ society’s resources and the failure to use the cost-minimizing production technology.
Another possible change worth considering involves a change in the amount of resources available to society. Suppose that the economy acquires additional stocks of land, labor, or capital. In that case, it will be possible to increase the production of both goods beyond combinations available on the PPF. The entire PPF will shift outwards in that case, and society will be able to produce more of both goods. Such an expansion of society’s production capabilities is referred to as economic growth. This case is represented in the graph on the right in Figure 2.5. Similarly, a loss of resource stocks due to war, population decline, or sale will lead to an economiccontraction, or an inward shift of the PPF. The reason the PPF shifts inward in this case is that the resources themselves have been lost. This loss of resources is very different from the unemployment of existing resources. In the latter case, the resources still exist, but they are not employed. In the former case, the resources are no longer available at all and so society’s production possibilities have changed.
Outward and inward shifts of the PPF may also result from a change in the existing state of technological knowledge. If society discovers new production technologies then it will be possible to produce production combinations that are beyond the initial PPF. That is, greater production of both goods becomes possible and economic growth occurs. On the other hand, a loss of production technology would lead to an economic contraction and an inward shift of the PPF. A loss of production technology may not seem like a very likely scenario, but it can occur if, for example, skilled workers begin to lose their skills due to long spells of unemployment. In this case, the knowledge of how to produce is lost, which is a very different scenario than the situation mentioned previously involving a failure to use the best available production technology.
Applications of the Production Possibilities Model
We now have all the tools necessary to apply the production possibilities model to concrete situations. For example, consider the case of U.S. economic growth during the twentieth century. A number of factors led to the rapid expansion of the U.S. economy during that period, including population growth, growth of the nation’s capital stock, and technological change. This situation is depicted in the graph on the right in Figure 2.5. Economic historians generally agree that, even though each of these factors contributed to the growth of the U.S. economy, technological change had the greatest impact and made possible the large increase in living standards that occurred during this period.
Another application involves the role of investment in the economy. The reader should recall that investment refers to the growth of the capital stock through time. To explore the implications of an increase in investment, we might begin by treating capital goods and consumer goods as our two goods in the production possibilities model. This approach departs a bit from our earlier presentation in that capital goods are simultaneously treated as a produced good and as a resource. Figure 2.6 shows an example of two different economies that have capital goods and consumer goods as their produced outputs.
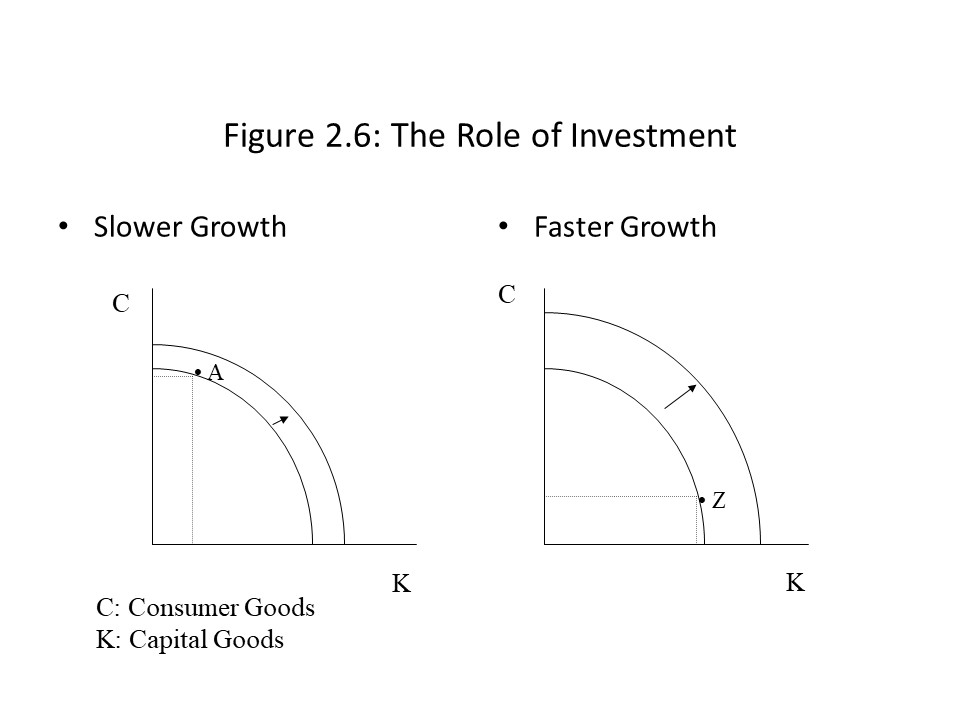 In the graph on the left in Figure 2.6, one can see that the economy is producing a great deal of consumer goods and relatively few capital goods at point A. Because the economy invests little in new capital goods, the capital stock grows only slowly. Therefore, the PPF experiences a relatively small outward shift and the growth rate of the economy is relatively low. In the graph on the right, on the other hand, the economy produces a great deal of capital goods and relatively few consumer goods. Because it invests so much in new capital goods, the capital stock grows very rapidly and the production possibilities expand rapidly as well, as indicated by the outward shift of the PPF. It is sometimes argued that the Japanese economy grew much more rapidly than the U.S. economy during the post-World War II period precisely because the Japanese invested so much in new capital. The high saving rate among Japanese households made possible the accumulation of funds in banks, which then were loaned to Japanese corporations who used the funds for investment purposes. The so-called Japanese Miracle, which included extremely rapid annual growth rates, was the consequence. At the same time, U.S. consumers were eager to consume after having experienced considerable deprivation during the Great Depression and the subsequent period of wartime rationing. Because Americans spent a great deal of their income and saved little, the economic growth rate was lower than Japan’s during this period. In general, the example illustrates that a tradeoff exists between present consumption and future consumption. Just as individuals might postpone present consumption to expand their future consumption possibilities, entire societies may also postpone present consumption and consume more in the future. Similarly, societies that consume a great deal today should not expect as much consumption in the future.
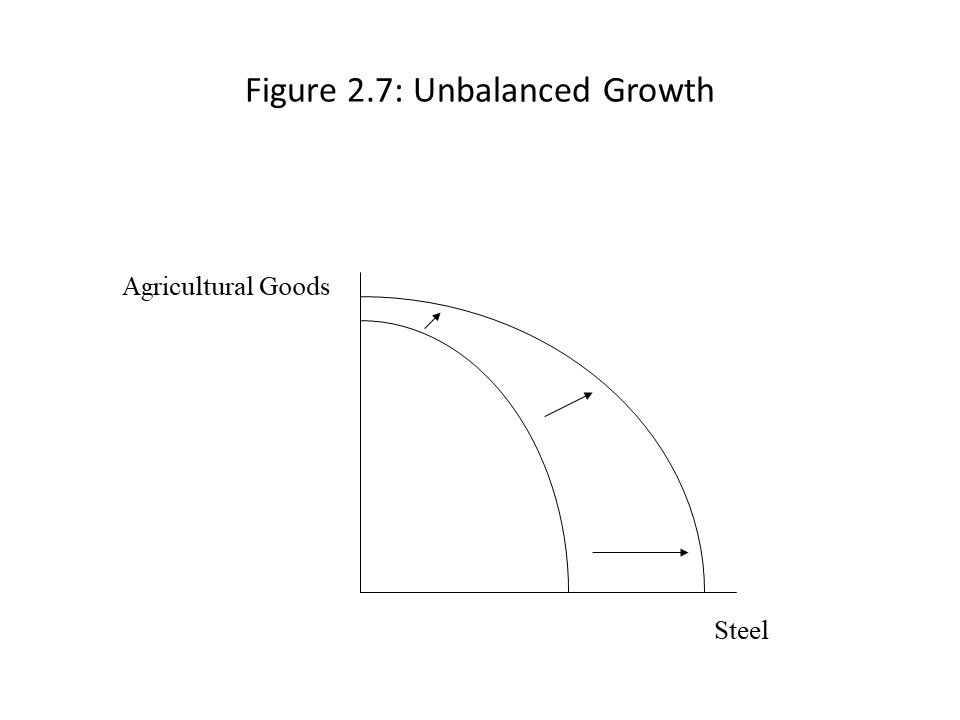 Figure 2.7 suggests that unbalanced growth has occurred in favor of the production of steel. This situation has arisen at times in the history of the steel industry when new steel furnaces were introduced. For example, the introduction of the open-hearth furnace that replaced Bessemer furnaces in the late nineteenth century and the introduction of the basic oxygen furnace that replaced the open-hearth furnace in the mid-twentieth century led to growth in the steel industry (and in steel-consuming industries) that was more rapid than in other sectors. In general, it would be unusual for resource gains or technological advances to have a uniform impact across all industries leading to perfectly balanced economic growth. Therefore, when economic expansions occur, we should expect to observe unbalanced growth.
It is also possible that one industry experiences economic growth while another industry experiences economic contraction. This situation is depicted in Figure 2.8.
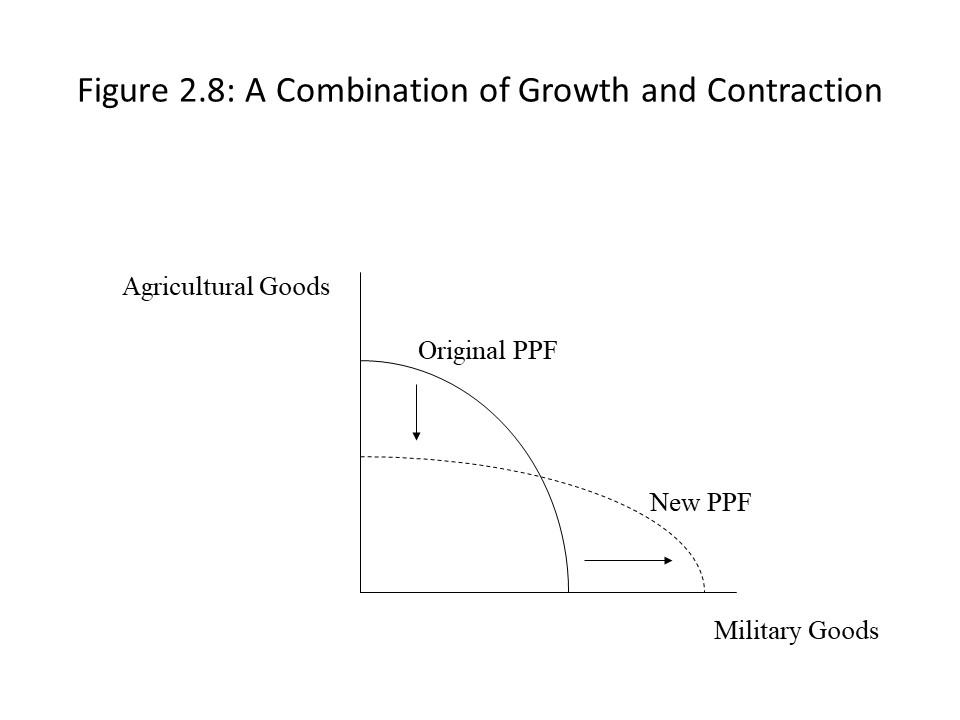 In Figure 2.8, the agricultural sector contracts at the same time that the military goods sector expands. This change might occur because the amount of arable land available diminishes due to soil erosion. At the same time, new production technologies in the production of military weaponry might lead to an expansion in that sector. In spite of this possibility, in many market economies, it is common to observe most industries contracting or expanding at the same time, albeit in an unbalanced way.
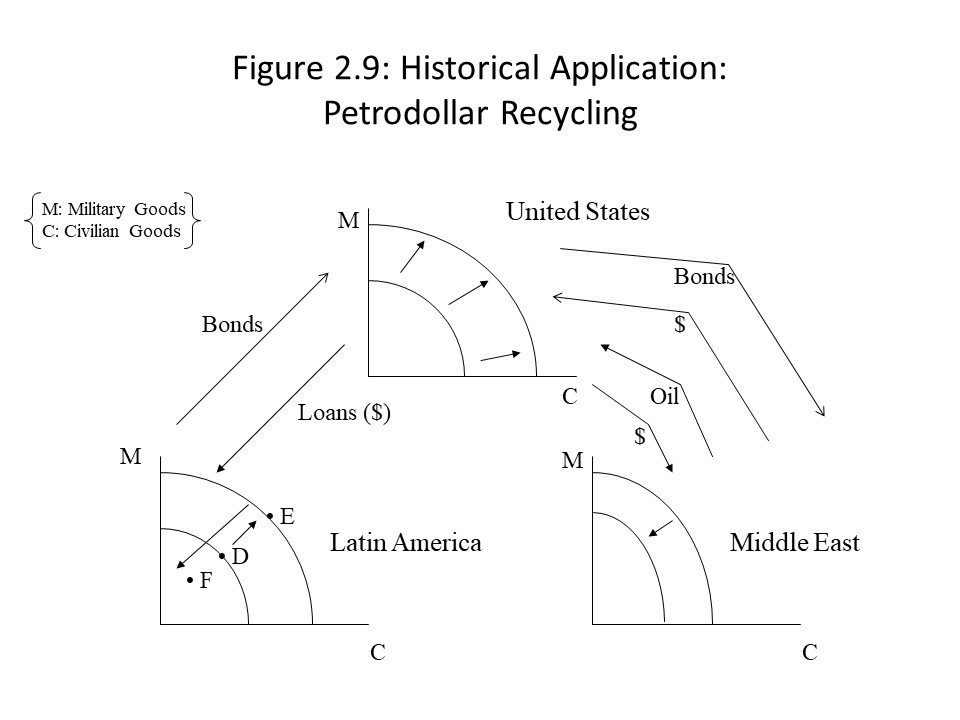
At the same time, the loss of oil resources led to a contraction of production possibilities in the Middle East, particularly because a large amount of the petrodollars received were not used to obtain more resources or improved technology. Instead, as Figure 2.9 shows, the dollars were recycled through the purchase of U.S. financial assets. Additionally, U.S. banks loaned the petrodollars to Latin American nations, including Mexico, Brazil, and Argentina. These funds were badly needed due to high oil prices, but they were also used for an expansion of these nations’ production possibilities, as shown in Figure 2.9. Once interest rates began to rise in the early 1980s in the United States, however, the burden of the rising debt became too great for these Latin American nations. Mexico defaulted on its debt in 1982. The ensuing panic led U.S. banks to restrict their lending to Latin American nations. The consequence was a sharp rise in unemployment, stagnant economic growth, and falling incomes. The economic boom in Latin America represented in the movement from D to E in Figure 2.9 was followed by a bust as represented in the movement from E to F. Because this process appeared to benefit the United States at the expense of Latin American nations, many critics have accused the U.S. of developing a neocolonial relationship with these nations.[13]
The Neoclassical Classification Scheme for Economic Systems
Even though the production possibilities model is a completely general model in that it may be applied to any economic system, neoclassical economists are primarily interested in understanding how market capitalist economies function. To better understand the differences between alternative economic systems, we will consider the neoclassical classification scheme for economic systems in this section.
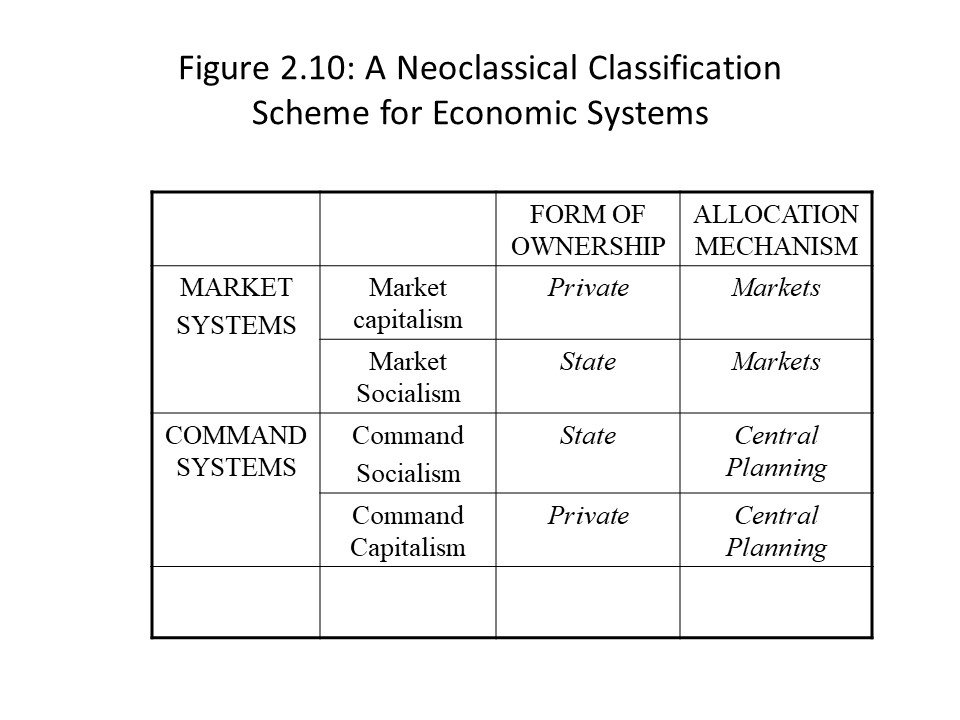
According to neoclassical economists, economic systems have two primary elements.[14] The first element is the form of property ownership. Property ownership may take different forms, but the two forms that neoclassical economists consider to be the worthiest of our attention are private ownership and state ownership. Private ownership refers to ownership of the means of production and land by private citizens whereas state ownership refers to ownership of means of production and land by the government. The second element is the allocation mechanism that is used to allocate resources and to distribute goods and services. Different allocation mechanisms exist as well, but the two types that neoclassical economists consider to be the worthiest of our attention are market allocation and centrally planned allocation. Market allocation refers to the allocation of resources and the distribution of goods and services by means of markets. That is, resources and goods are transferred from buyers to sellers in the competitive marketplace where prices for these items are established by the free interaction of economic agents. Centrally planned allocation, on the other hand, involves the allocation of resources and the distribution of goods and services according to a central plan developed by government officials.
Because two forms of property ownership and two types of allocation mechanism have been identified, it is possible to name four possible economic systems based on how we mix and match these different elements. Figure 2.10 reveals that the neoclassical classification scheme gives rise to two types of market systems and two types of command systems.
 Market capitalism is the economic system that combines private ownership of the means of production and land with market allocation of resources and goods and services. Presently, most of the nations on Earth are either market capitalist economies, or they are in the process of transition towards market capitalist economies. The United States, Japan, Germany, the United Kingdom, Canada, Mexico, and so on, can all be regarded as market capitalist economies.
Not long ago, however, the defenders of market capitalism were engaged in a bitter dispute with the defenders of command socialism. In fact, these two economic systems were in direct competition with one another during the Cold War which ended with the dissolution of the Soviet Union in 1991. Command socialism merges state ownership of land and the means of production with a centrally planned allocation of resources. During the Cold War, many nations could be regarded as possessing command socialist economies, including the Soviet Union, the People’s Republic of China, Cuba, and many other nations. Today, only Cuba and North Korea possess economies based on the traditional command socialist model.
Private ownership and market allocation frequently have been linked in an historical sense. Similarly, state ownership and the central allocation of resources have been linked throughout history. Figure 2.10 reveals, however, that two other economic systems are theoretically possible using this classification scheme. These hybrid forms or cross forms, as they are called, have existed historically, but they are much less common than market capitalism and command socialism.[15]
One of the hybrid forms is market socialism, which combines state ownership of the means of production and land with the market allocation of resources. Probably the best-known example of a market socialist economy is that of Yugoslavia from the early 1950s until the early 1980s. The Yugoslav economy was based on worker-managed enterprises that were “socially owned,” but these enterprises operated in competitive markets.[16] The fact that Yugoslavia pursued a path that sharply deviated from the one Stalin wished to see coincided with considerable tension between the Yugoslav leadership and the Soviet leader.[17] In the 1980s, the economic system began to unravel due to ethnic and religious warfare that ultimately led to the fragmentation of the nation.[18]
People often believe Sweden and other Scandinavian economies to be market socialist economies. This view is incorrect, however, if we rely on the neoclassical classification scheme. Sweden, for example, is characterized mainly by the market allocation of resources and goods as well as private ownership of land and the means of production. What leads many people to assume that Sweden is market socialist is that the government also engages in a significant amount of income redistribution. With high tax rates and extensive government programs to provide job training and income security, people regard it as socialist. Because the element of state ownership is not dominant, however, it cannot be correctly regarded as socialist using our schema. On the other hand, Sweden is sometimes regarded as a social market economy.[19] A social market economy is a market capitalist economy that is characterized by extensive income redistribution and a social safety net.[20] Sweden as well as other nations like it may, therefore, be correctly regarded as a special kind of market capitalist economy.
The second hybrid form is command capitalism. This economic system combines central planning and private ownership of the means of production and land. This economic system has existed at times, mainly during periods of wartime. The best-known example of a command capitalist economy is Nazi Germany.[21] Nazi Germany was characterized by the private ownership of the means of production, but government planning was used to direct the flow of resources to support the war effort. Major industrial producers, like Krupp, were privately owned and the profits from production were collected by the owners.[22] At the same time, they were not free to set production levels but instead accepted the orders of government officials.[23] Interestingly, the U.S. economy possessed significant elements of command capitalism during World War II.[24] Major American producers continued to be privately owned but wartime boards set production levels and prices to ensure victory in the war.
Of course, any given society will possess elements of both types of property ownership and both kinds of allocation mechanism. In other words, all economies are mixed economies to some degree, and we should not expect to observe any economic system in its pure form.[25] Which type of property ownership dominates and which type of allocation mechanism dominates in that society will determine how we choose to classify it using the classification scheme given here.
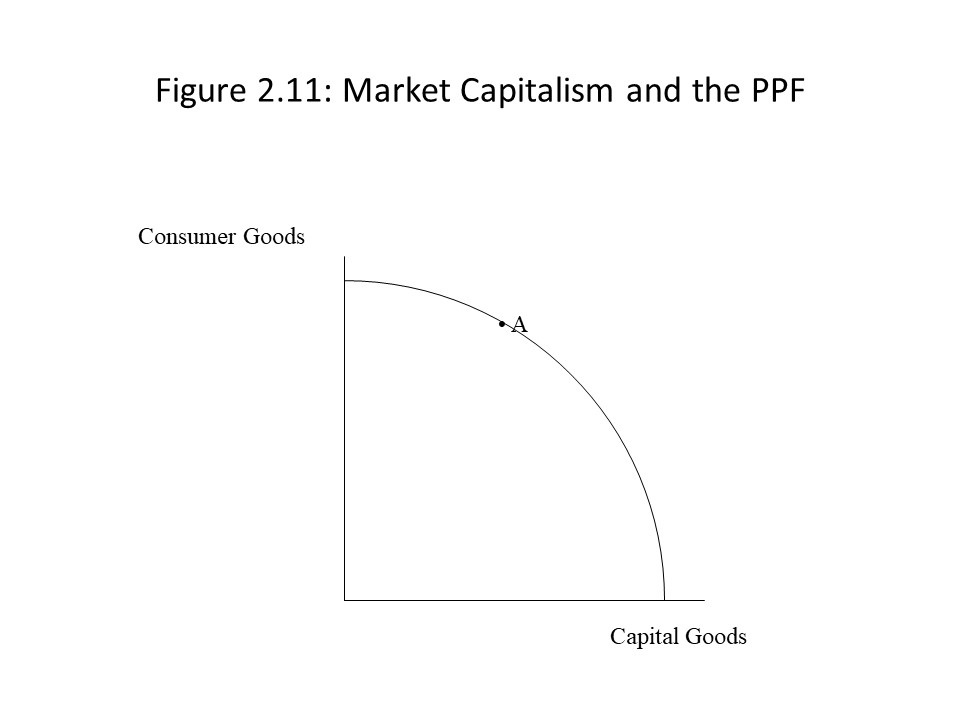
Now that we have a method of classifying different economic systems, we might ask whether any of these economic systems will achieve economic efficiency. In other words, we know that the ideal society according to neoclassical theory is the one that achieves economic efficiency, but which economic system is most likely to generate this outcome? If we can answer that question, then we will have a much clearer idea of what neoclassical economists regard as the good society, which is the main concern of this chapter. It turns out that neoclassical economists argue that market capitalism is the one economic system that can generate economic efficiency. That is, competition within markets between buyers and sellers of privately owned property will automatically lead, as if by an invisible hand, to the economically efficient outcome. The economy will end up both on the PPF and at the optimal point on the PPF accounting for societal preferences, as represented by point A in Figure 2.11.
 Unfortunately, the reader must wait for a complete explanation as to how market capitalism achieves this result. The neoclassical demonstration of this claim will be explored in detail in chapters 3 and 8.
Before leaving this subject, however, it might be worth mentioning that the widespread use of money in market capitalist societies is an important reason why neoclassical economists argue that such societies achieve economic efficiency. The use of money promotes efficiency because it solves a serious problem that exists in barter economies called the double coincidence of wants problem. Barter economies are economies in which goods are directly traded for one another without the mediating role of money to facilitate exchange. For example, suppose that Dave has 2 cows that he wishes to exchange for so many desks. In the absence of money, to successfully carry out this exchange, Dave must find someone who is willing to sell desks, but that same person must want to purchase cows. Hence, a double coincidence of wants problem exists in this case. That is, Dave must find a person willing to sell desks and that person must be willing to buy cows. If Dave finds such a person, then the price of the two cows in terms of desks must be negotiated as well. If money is present, on the other hand, then Dave only needs to sell his cows for money, and then he can use the money to buy desks from a seller of desks. Of course, the price of each good must still be negotiated, but it is no longer necessary that the seller of desks also be the buyer of cows. The double coincidence of wants problem is thus solved as soon as money enters the picture.
Money thus promotes efficiency because it reduces transaction costs, which are the costs associated with carrying out an exchange. Transaction costs are much higher in a barter economy than in a monetary economy because the time spent searching for a buyer who is simultaneously a seller is rather great in a barter economy. Furthermore, because money reduces transaction costs, it encourages people to rely more heavily on exchange to meet their needs. As a result, people are encouraged to specialize more than they otherwise would. Specialization increases efficiency, and so money promotes efficiency in this way as well.
A Marxian Classification Scheme for Social Formations
Before closing this chapter, we might consider an alternative to the neoclassical classification scheme for economic systems. Marxian economists use very different language to differentiate between economic systems. Even when the language overlaps, Marxists understand similar sounding economic systems in very different ways from their neoclassical counterparts.
To begin, Marxian economists generally refer to social formations rather than economic systems. The concept of a social formation is a very broad concept that has two major components. The first component is the economic base or mode of production. All the economic processes in society comprise the economic base. These processes relate specifically to how production is carried out and by whom. The second component is the socialsuperstructure. The social superstructure consists of all the political, religious, cultural, and familial processes that reflect the underlying economic base.
Marxian economists recognize that the economic base and the social superstructure may each influence the other. For example, changes in the methods of production employed might influence political decision makers. Similarly, changes in religious beliefs and customs might influence how production is carried out. Although Marxian economists recognize multi-directional causality in their analyses of these concepts, traditionally they have given the greatest attention to the economic base. As Richard Wolff and Stephen Resnick argue, a twofold reason exists for this emphasis on the economic base and the conflict-ridden class relationships that often characterize it.[26] First, Marxists assert that class conflict is a greatly under-theorized aspect of human society. As a result, Marxists have frequently striven to place it at the center of their economic analyses. Second, Marxists believe that the neglect of class relationships in economic analysis has served as a barrier to the construction of an alternative society capable of eliminating class conflict. As a result, Marxian analyses often appear to give greater causal weight to the economic base even though this appearance stems primarily from a desire to call attention to the role of economic processes and class conflict in our society.
The economic base or mode of production also consists of two key parts. First, the social forces of production refer to the entire stock of accumulated knowledge of how to produce. All the production techniques, scientific expertise, and engineering capabilities of members of society fall into this category. The second major feature that defines a mode of production is the social relations of production. The social relations of production refer to all the patterns of interaction that exist between producers within a given society. One major difference that exists between modes of production is the presence or absence of class exploitation. Whenever a class other than the direct producers appropriates and distributes the products of the direct producers, then that mode of production is considered exploitative.[27]
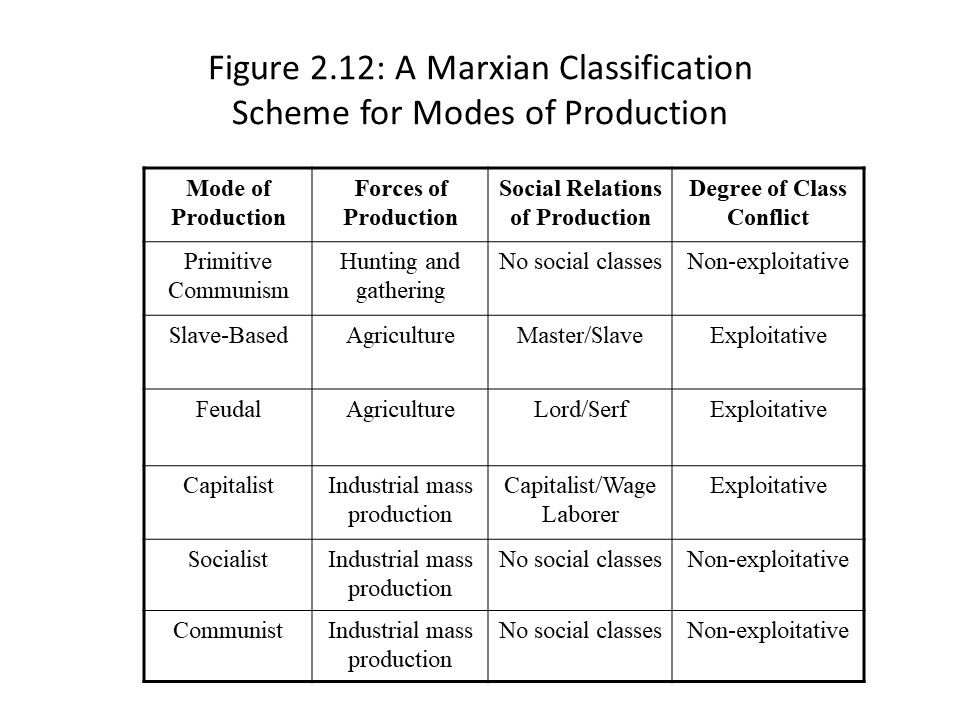
Using the two key components of a mode of production, Marxian economists differentiate between several different modes of production.[28] The primitive communist mode of production consists of rather primitive social forces of production, including primarily hunting and gathering techniques. The social relations of production in the primitive communist mode of production involve production within relatively small familial or tribal groups that own the land and means of production in common. This kind of society does not involve class exploitation because not enough wealth is produced to create class distinctions and conflict.
The social forces of production in the slave-based mode of production consist mainly of agricultural production techniques. The social relations of production in the slave-based mode of production involve primarily the master/slave relationship. A small class of masters owns the land and means of production as well as a much larger class of slaves. The slaves carry on agricultural production, and the products that the slaves produce are appropriated and distributed by the master class. Because the production that occurs in slave societies is appropriated and distributed by someone other than the direct producers, slave-based forms of society are definitely exploitative.
The social forces of production in the feudal mode of production consist mainly of agricultural production methods as well. The social relations of production in the feudal mode of production involve primarily the lord/serf relationship. A small class of feudal lords within this mode of production employs a much larger class of serfs to work the land. The serfs are not exactly slaves, but they are not free either. Instead, serfs within the feudal mode of production are bound to the land by tradition, custom, and religious belief. The social hierarchy is accepted as part of the natural order. The serfs view it as their right to work the land by handing over a portion of their produce to the lord, and the lord views it as his right to appropriate and distribute this production. In return, the feudal lord provides the serfs with protection from hostile, outside forces. The feudal mode of production is also exploitative in nature because the direct producers do not directly appropriate and distribute the fruits of their labor.
The capitalist mode of production has been the mode of production of greatest interest to Marxian economists much as market capitalism has been the economic system of greatest interest to neoclassical economists. The social forces of production within the capitalist mode of production include large-scale machinery and mass production techniques employed within factories and large production plants. The social relations of production, on the other hand, involve production by a large class of wage laborers and the appropriation and distribution of their products by a small class of capitalists who employ them. The wage laborers are not slaves because the capitalists do not own them in the way that masters own slaves. Nevertheless, Marxian economists regard this mode of production as exploitative because the wage laborers do not appropriate or distribute the products of their labor. Instead, capitalists appropriate and distribute the products of wage workers because they own the means of production and the land.
The socialist mode of production is another mode of production of great interest to Marxian economists. According to Marxian economists, this mode of production will only come into being due to a revolutionary upheaval that abolishes capitalism and the distinction between capital and wage labor. Because this mode of production has not yet replaced capitalism, our description of it is based mostly on conjecture. Nevertheless, the social forces of production within the socialist mode of production are likely to include large-scale machinery and mass production techniques within complex enterprises. The social relations of production, on the other hand, will likely involve direct control of production enterprises by the direct producers. The direct producers will most likely own these enterprises in common, and compensation within enterprises will be linked directly to the duration and intensity of the work performed. The socialist mode of production is not exploitative because class distinctions will be abolished, and the direct producers will appropriate and distribute the fruits of their own labor.
The communist mode of production is another mode of production that has not yet come into existence. For Marxian economists, it represents the most advanced form of human society in which human beings have entered a harmonious relationship with nature. The communist mode production thus marks the end of history in the sense that the class struggle that underlies humanity’s current economic problems permanently ends. Although the socialist mode of production abolishes the class struggle, some remnants of the capitalist mode of production will persist within the socialist mode of production. For example, only with the transition to the communist mode of production will compensation according to work performed be replaced with compensation according to need. This difference in compensation, which marks a difference in the social relations of production, is the primary difference between the socialist and communist modes of production. Otherwise, Marxian economists expect the two modes of production to be quite similar.
Figure 2.12 summarizes the differences between the modes of production that have been discussed in this section.
 Marxian economists have identified other modes of production that are interesting, including the ancient mode of production and the Asiatic mode of production. The main purpose here is to introduce the reader to an alternative classification scheme for social formations (or modes of production to be more precise). These terms will be used repeatedly throughout the book and so it will be helpful to have a firm grasp on them moving forward.
Following the Economic News [29]
In an opinion piece that appeared in the Ottawa Citizen, Christine McAllister analyzes the potential impact on the city budget of fare-free public transit. McAllister recognizes the great benefits of a public transportation system, including greater accessibility to transportation, reduced traffic congestion, and environmental benefits. In an interesting play on words, McAllister notes, however, that “no such thing as a free bus” exists. Neoclassical economists are fond of reminding non-economists that “no such thing as a free lunch” exists because everything we desire has a cost associated with it even if the user does not pay a monetary price for the product or service. In this case, the $3 billion budget for the City of Ottawa will need to involve reallocations of expenditure away from some important priorities to fund a massive expansion of the public transportation system. The budgetary shift might involve cutting back on “affordable housing, better city services, or fighting climate change.” If expenditure is not reallocated, then tax increases can be adopted to fund the expansion of the public transit system. McAllister asserts that funding for the $200 million project will require an increase in property taxes of $500 for each household in the city. Therefore, the tradeoff between fare-free public transit and other economic priorities remains. That is, households will purchase fewer commodities so that they can pay the taxes to finance the expansion of the transportation system. The harsh reality of opportunity cost cannot be avoided, and difficult decisions must be made. McAllister argues that the tradeoffs involved in such budget proposals must be clearly demonstrated and that planning must take these tradeoffs into account. As a candidate for City Council, McAllister draws upon fundamental principles of neoclassical economics to warn citizens about the potential costs of fare-free transit.
Summary of Key Points
- Throughout history many different views of the good society have been put forward including, but not limited to, the Platonic, Christian, Hindu, Muslim, Marxist, Randian, and neoclassical perspectives.
- The neoclassical economic problem facing all human societies is how to transform scarce resources into goods and services to satisfy unlimited economic wants.
- Land, labor, and capital are the three major resource categories in neoclassical economic theory.
- Stock variables are measured as of a point in time and flow variables are measured per unit of time.
- The neoclassical ideal of economic efficiency requires full employment of resources, productive efficiency, and allocative efficiency.
- The production possibilities model offers a graphical representation of the economic problem and the conditions for economic efficiency.
- The production possibilities model reveals that all societies incur opportunity costs and increasing opportunity costs due to the presence of heterogeneous resources.
- Society achieves allocative efficiency when it equates the marginal benefit and the marginal cost of the last unit produced of each good or when net marginal gain is zero for each good.
- When resources are unemployed or the cost-minimizing technology is not used, society moves inside its PPF. When resource stocks or the available technology changes, however, the PPF itself shifts.
- The form of property ownership and the allocation mechanism determine the type of economic system a society possesses in neoclassical economic theory.
- In Marxian economic theory, a social formation depends on the mode of production and the social superstructure. The mode of production, in turn, depends on the social forces of production and the social relations of production.
List of Key Terms
Theocratic governments
Economic problem
Resources (factors of production or inputs)
Technology
Wants
Land
Capital
Financial capital
Investment
Stock variable
Flow variable
Wealth
Income
Labor
Economic efficiency
Full employment
Static efficiency
Dynamic efficiency
Productive efficiency
Allocative efficiency
Production possibilities model
Production possibilities schedule
Production possibilities frontier (PPF)
Tradeoffs
Opportunity costs
Total opportunity cost
Marginal opportunity cost
Law of increasing opportunity cost
Heterogeneous resources
Homogeneous resources
Law of diminishing returns
Cost-benefit analysis
Marginal cost (MC)
Marginal benefit (MB)
Diminishing marginal benefit of consumption
Increasing marginal cost of production
Net marginal gain
Economic growth
Economic contraction
Unbalanced growth
Unbalanced contraction
Form of property ownership
Private ownership
State ownership
Allocation mechanisms
Market allocation
Centrally planned allocation
Market capitalism
Command socialism
Hybrid forms
Cross forms
Market socialism
Social market economy
Command capitalism
Mixed economies
Barter economies
Double coincidence of wants problem
Transaction costs
Social formations
Economic base (or mode of production)
Social superstructure
Social forces of production
Social relations of production
Class exploitation
Primitive communist mode of production
Slave-based mode of production
Feudal mode of production
Capitalist mode of production
Socialist mode of production
Communist mode of production
Problems for Review
- Suppose society’s production possibilities table and PPF are the ones shown in Figure 2.13.
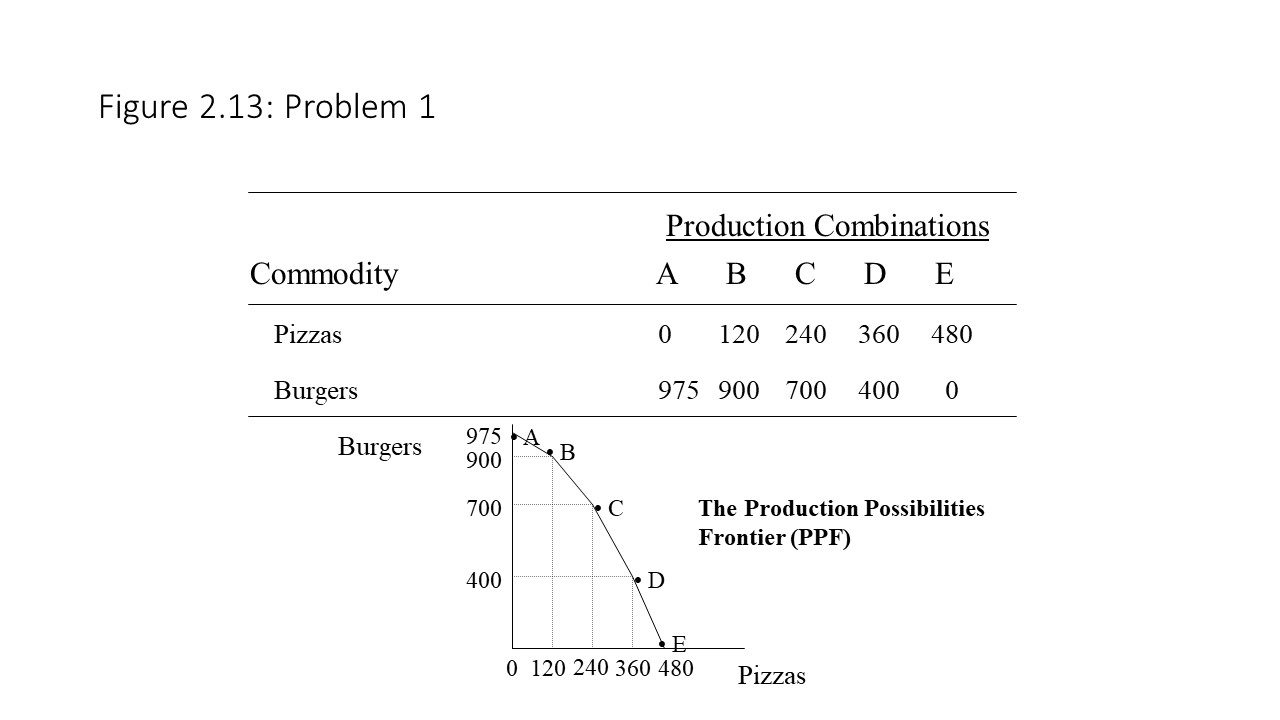 Answer the following questions:
- What is the total opportunity cost of producing 360 pizzas?
- What is the total opportunity cost of producing 900 burgers?
- What is the marginal opportunity cost of increasing pizza production from 120 to 240 pizzas?
- What is the marginal opportunity cost of increasing burger production from 400 to 700 burgers?
- What is the marginal opportunity cost of the 480th pizza?
- What is the marginal opportunity cost of the 700th burger?
- What is the marginal opportunity cost of producing the 900th burger?
- Considering your answers to the previous two questions, what happens to the marginal opportunity cost of producing burgers when burger production rises from 700 to 900 burgers? How would a neoclassical economist answer this question?
2. Using the graph and the table in Figure 2.14, can you fill in the missing pieces of information that are marked with a question mark?
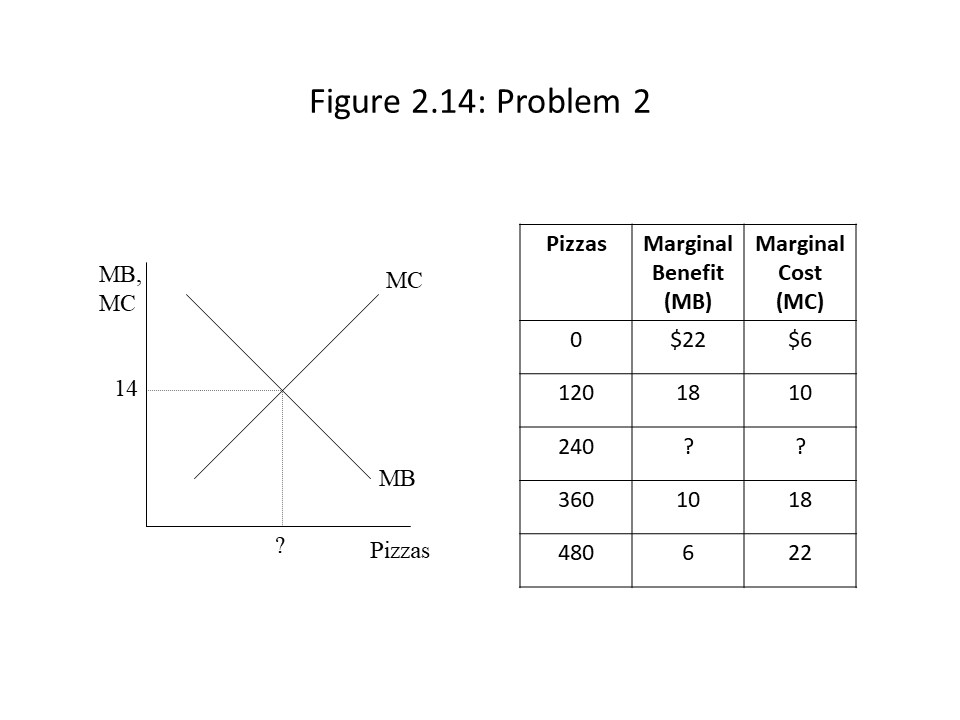 Explain the meaning of each number that you fill in as well as the significance of this row in the table.
- For a nice summary of Gandhi’s economic perspective, see Rosser and Rosser (2004), p. 90-91. ↵
- Ibid. p. 467. ↵
- Ibid. p. 94. ↵
- Ibid. 95. ↵
- Ibid. 95. ↵
- Ibid. 100-105. Rosser and Rosser provide a detailed overview of these Islamic economic principles. ↵
- See Rand (1966). ↵
- The reader should notice the emphasis on the neoclassical entry point in this statement of the economic problem. That is, given resources, given technology, and given wants or preferences are assigned a central place. ↵
- McConnell and Brue (1996), p. 25, postpone discussion of allocative efficiency until the details of the model are developed. ↵
- The use of the total opportunity cost and marginal opportunity cost measures may be found in McConnell and Brue’s earlier editions. For example, see McConnell and Brue (1996). p. 26. ↵
- OpenStax College (2014), p. 36, asserts that the controversial nature of this question makes it a relevant question for sociologists, philosophers, and political scientists. ↵
- See Bade and Parkin (2013), p. 141-144, for one example of how this method is used to arrive at the allocatively efficient quantities of the two commodities. ↵
- For an overview of these issues and an explanation of how the debt crisis eliminated social welfare gains in the debtor countries, see Carrasco (2011). ↵
- Rosser and Rosser (2004), p. 6, identify six dimensions but agree that these two dimensions are the most important ones. ↵
- Ibid. p. 8. Rosser and Rosser also identify these four commonly recognized types of economic system. ↵
- Ibid. p. 389-390. ↵
- Ibid. p. 397. ↵
- Ibid. p. 389-390. ↵
- Ibid. p. 203. ↵
- Ibid. p. 203. ↵
- Ibid. p. 9. ↵
- Ibid. p. 9. ↵
- Ibid. p. 9. ↵
- Ibid. p. 9 ↵
- Ibid. p. 9. ↵
- Wolff and Resnick (2012), p. 47. ↵
- Ibid. p. 27. ↵
- Ibid. p. 160-163. Wolff and Resnick describe these different modes of production as different forms of the fundamental class process. ↵
- McAllister, Christine. “There’s no such thing as a free (bus); Transit comes with cost tradeoffs, says candidate Christine McAllister.” Ottawa Citizen. Early Edition. 15 Oct. 2018. ↵