The Law of Demand
In general, the law of demand states that the quantity demanded and the price of a good or service is inversely related, other things remaining constant.
Learning objectives
Explain the concept of demand and discuss the factors that affect it
In economics, the law of demand states that the quantity demanded and the price of a good or service is inversely related, other things remaining constant. Therefore, the demand curve will generally be downward sloping, indicating the negative relationship between the price of a good or service and the quantity demanded.
Movement along the Demand Curve
If the income of the consumer, prices of the related goods, and preferences of the consumer remain unchanged, then the change in quantity of good demanded by the consumer will be negatively correlated to the change in the price of the good or service. The change in price will be reflected as a move along the demand curve.
Shift in the Demand Curve
The demand curve will shift, move either inward or outward as a result of non-price factors. A shift in demand can be related to the following factors (non-exhaustive list):
- Consumer preferences
- Consumer income
- Change in the price of related goods (i.e. compliments)
- Change in the number of buyers
- Consumer expectations
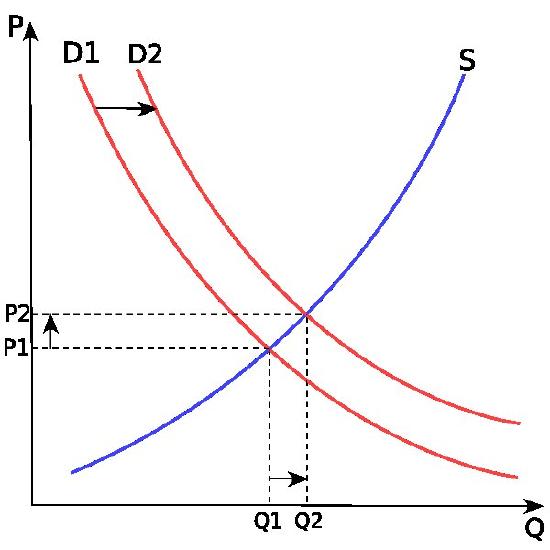
Law of Demand: A demand curve, shown in red and shifting to the right, demonstrating the inverse relationship between price and quantity demanded (the curve slopes downwards from left to right; higher prices reduce the quantity demanded).
Though in general terms and specific to normal goods, demand will exhibit a downward slope, there are exceptions: Giffen goods and Veblen goods
Giffen Goods
A Giffen good describes an extreme case for an inferior good. In theory, a Giffen good would display the characteristic that as price increases, demand for the product increases. In the real world application, there has not been a true example of a Giffen good, though a popular albeit historically inaccurate example is the purchase of potatoes (an inferior good) as prices continued to increase during the Irish potato famine.
Veblen Goods
Some expensive commodities like diamonds, expensive cars, designer clothing and other high-price limited items, are used as status symbols to display wealth. The more expensive these commodities become, the higher their value as a status symbol and the greater the demand for them. The amount demanded of these commodities increase with an increase in their price and decrease with a decrease in their price. These goods are known as a Veblen goods.
Demand Schedules and Demand Curves
A demand curve depicts the price and quantity combinations listed in a demand schedule.
Learning objectives
Describe the relationship between demand curves and demand schedules
The demand curve is a graphical representation depicting the relationship between a commodity’s different price levels and quantities which consumers are willing to buy. The curve can be derived from a demand schedule, which is essentially a table view of the price and quantity pairings that comprise the demand curve.
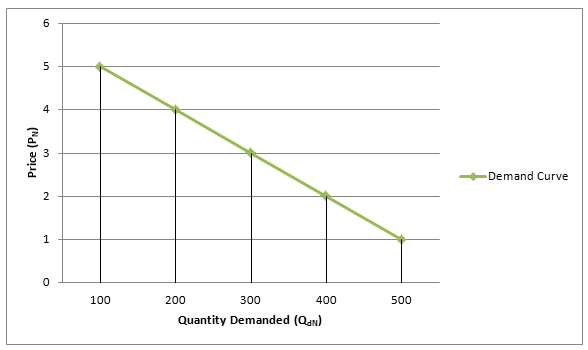
Demand Schedule and Curve: The demand curve is the graphical representation of the economic entity’s willingness to pay for a good or service. It is derived from a demand schedule, which is the table view of the price and quantity pairs that comprise the demand curve.
Given that in most cases, as the price of a good increases, agents will likely decrease consumption and substitute away to another good or service, the demand curve embodies a negative price to quantity relationship. The curve typically slopes downward from left to right; though there are some goods and services that exhibit an upward sloping demand, these goods and services are characterized as abnormal.
The demand curve of an individual agent can be combined with that of other economic agents to depict a market or aggregate demand curve. Using a demand schedule, the quantity demanded per each individual can be summed by price, resulting in an aggregate demand schedule that provides the total demanded specific to a given price level. The plotting of the aggregated quantity to price pairings is what is referred to as an aggregate demand curve. In this manner, the demand curve for all consumers together follows from the demand curve of every individual consumer.
The demand curve in combination with the supply curve provides the market clearing or equilibrium price and quantity relationship. This is found at the intersection or point at which the supply and demand curves cross each other.
Market Demand
Market demand is the summation of the individual quantities that consumers are willing to purchase at a given price.
Learning objectives
Examine the relationship between market demand and individual demand
The demand schedule represents the amount of some good that a buyer is willing and able to purchase at various prices. The relationship between price and quantity demanded reflected in this schedule assumes the following factors remain constant:
- Income levels;
- Population;Tastes and preferences;
- Price of substitute goods; and
- Price of complementary goods
The demand schedule is depicted graphically as the demand curve. The demand curve is shaped by the law of demand. In general, this means that the demand curve is downward-sloping, which means that as the price of a good decreases, consumers will buy more of that good.
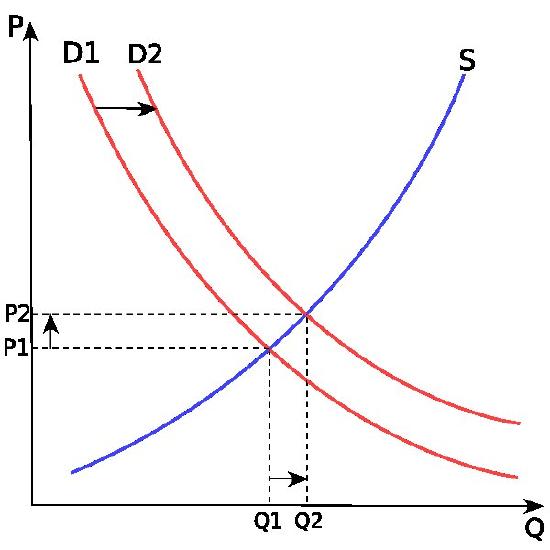
Demand Curve: The demand curve is the graphical depiction of the demand schedule. For most goods and services, the demand curve exhibits a negative relationship between price and quantity and is as a result downward sloping.
A market demand schedule is a table that lists the quantity of a good all consumers in a market will buy at every different price. A market demand schedule for a product indicates that there is an inverse relationship between price and quantity demanded. The graphical representation of a market demand schedule is called the market demand curve.
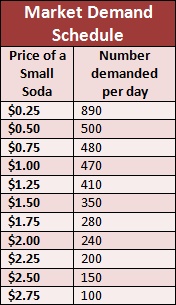
Market Demand Schedule: A market demand schedule is a table that lists the quantity of a good all consumers in a market will buy at every different price.
The determinants of demand are:
- Income
- Tastes and preferences
- Prices of related (AKA complimentary) goods and services
- Prices of substitutes
- Number of potential consumers
The market demand is the summation of the individual quantities that consumers are willing to purchase at a given price.
As noted, both individual demand curves and market demand are typically expressed as downward shaping curves. However, special cases exist where the preference for the good or service may be perverse. Two different hypothetical types of goods with upward-sloping demand curves are Giffen goods (an inferior but staple good) and Veblen goods (goods characterized as being more desirable the higher the price; luxury or status items).
Ceteris Paribus
Ceteris paribus is defined as “all else being equal,” or “holding all else constant”.
Learning objectives
Explain the rationale for the assumption of ceteris paribus
Economics seeks to interpret, analyze and or evaluate situations that occur between individuals, firms and other entities. Due to the potential for multiple agents and other known and unknown external activities to be involved or present but not relevant to an analysis, economics employs the assumption of “all else constant,” which is the English translation of the Latin phrase “ceteris paribus”.
When the ceteris paribus assumption is employed in economics, all other variables – with the exception of the variables under evaluation – are held constant.
A Macroeconomic Example
What would happen to the demand for labor by firms if a minimum wage was imposed at a level above the prevailing wage rate, ceteris paribus? As depicted in below, the supply and demand curve are held constant, as are labor and leisure preferences for workers, and output considerations for firms, in addition to all other variables and characteristics embedded within the shape of the supply and demand curves. Thus, what is being evaluated is the impact of a constraint on market equilibrium.

Macroeconomics: Binding price floor: E is the equilibrium wage level when there is no binding minimum wage. When a minimum wage is imposed, ceteris paribus, suppliers of labor are willing to provide more labor than firms (demand for labor) are willing to purchase at the binding minimum wage rate. There is no shifting of either curve related to behavior influenced by the higher wage rate because ceteris paribus is holding labor-leisure trade-off (of workers) and substitution of labor (by firms) constant, along with other potential influencing variables.
A Microeconomic Example
What would happen for the demand for a normal good when income increases, ceteris paribus? In this case, as depicted in, a consumer’s preferences for the good and his demand for complements and substitutes are being held constant along with other attributes that could potentially impact his demand for a good, such as the good’s price. The supply of the good and the market and firm characteristics implicit in the shape of the supply curve are also held constant. This allows for an analysis of the increase in income, on the consumer’s demand for the single good alone.
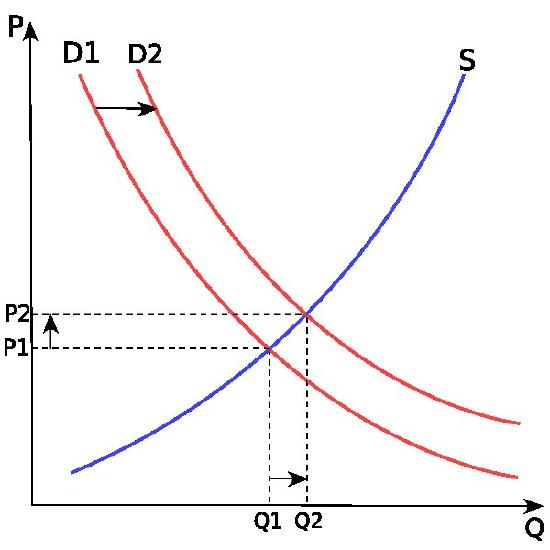
Microeconomics: Income and Demand: A consumer is able to purchase a normal good and has a demand curve, D1, which provides the relationship between price and quantity given his preferences, income and other consumption attributes. Assuming an increase in his income, ceteris paribus, his demand curve would shift outward to D2, corresponding to a higher quantity for each purchase price. The consumer would then move his consumption for the good from Q1 to Q2, increasing his purchase of the good.
Changes in Demand and Shifts in the Demand Curve
Demand is the relationship between the willingness to purchase a quantity of a good or service at a specific price.
Learning objectives
Distinguish between shifts in the demand curve and movement along the demand curve
The demand curve is a graphical representation of an economic agent’s willingness to purchase a given quantity of a good or service at a specific price based on preferences, income, and other prevailing factors at a given point in time. Demand curves in combination with supply curves, which depict the price to quantity relationship of producers, are a representation of the goods and services market. Where the two curves intersect is market equilibrium, the price to quantity relationship where demand and supply are equal.
Movements in demand are specific to either movements along a given demand curve or shifts of the entire demand curve.
Movements along the demand curve are due to a change in the price of a good, holding constant other variables, such as the price of a substitute. If the price of a good or service changes the consumer will adjust the quantity demanded based on the preferences, income and prices of other factors embedded within a given curve for the time period under consideration.
Shifts in the demand curve are related to non-price events that include income, preferences and the price of substitutes and complements. An increase in income will cause an outward shift in demand (to the right) if the good or service assessed is a normal good or a good that is desirable and is therefore positively correlated with income. Alternatively, an increase in income could result in an inward shift of demand (to the left) if the good or service assessed is an inferior good or a good that is not desirable but is acceptable when the consumer is constrained by income.

Demand Curve: A demand curve provides an economic agent’s price to quantity relationship related to a specific good or service. Movements along a demand curve are related to a change in price, resulting in a change in quantity; shifts is demand (D1 to D2) are specific to changes in income, preferences, availability of substitutes and other factors.
A change in preferences could result in an increase (outward shift) or decrease (inward shift) in the quantity level desired for a specific price; while a change in the price of a substitute, could result in an outward shift if the price of the substitute increases and an inward shift if the substitute’s price decreases. The demand curve for a good will shift in parallel with a shift in the demand for a complement.
Key Points
- The demand curve is downward sloping, indicating the negative relationship between the price of a product and the quantity demanded.
- For normal goods, a change in price will be reflected as a move along the demand curve while a non-price change will result in a shift of the demand curve.
- Two exceptions to the law of demand are Giffen goods and Veblen goods.
- Demand curves are a graphical representation of a demand schedule, which is the table view of an economic agents’ price to quantity relationship.
- Demand curves embody preferences, substitution potential and income, as well as other characteristics that influence an economic agent’s ability to assess willingness to pay at a specific point in time for goods and services.
- Demand curves may be linear or curved.
- Aggregate demand is the sum of the quantity demanded for a specific price over a group of economic agents.
- The graphical representation of a market demand schedule is called the market demand curve.
- Following the law of demand, the demand curve is almost always represented as downward-sloping. This means that as price decreases, consumers will buy more of the good.
- Two different hypothetical types of goods with upward-sloping demand curves are Giffen goods and Veblen goods.
- When ceteris paribus is employed in economics, all other variables with the exception of the variables under evaluation are held constant.
- An example of the use of ceteris paribus in macroeconomics is: what would happen to the demand for labor by firms if a minimum wage was imposed at a level above the prevailing wage rate, ceteris paribus.
- An example of the use of ceteris paribus in microeconomics is: what would happen for the demand for a normal good when income increases, ceteris paribus.
- A change in price will result in a movement along a demand curve.
- A change in a non-price variable will result in a shift in the demand curve.
- An outward shift in demand will occur if income increases, in the case of a normal good; however, for an inferior good, the demand curve will shift inward noting that the consumer only purchases the good as a result of an income constraint on the purchase of a preferred good.
Key Terms
- Giffen good: A good which people consume more of as only the price rises; Having a positive price elasticity of demand.
- Veblen good: A good for which people’s preference for buying them increases as a direct function of their price, as greater price confers greater status.
- normal good: A good for which demand increases when income increases and falls when income decreases but price remains constant.
- equilibrium: The condition of a system in which competing influences are balanced, resulting in no net change.
- Market demand: The summation of the individual quantities that consumers are willing to purchase at a given price.
- ceteris paribus: all else equal; holding everything else constant
- normal good: A good for which demand increases when income increases and falls when income decreases but price remains constant.
- inferior good: a good that decreases in demand when consumer income rises; having a negative income elasticity of demand.
LICENSES AND ATTRIBUTIONS
CC LICENSED CONTENT, SPECIFIC ATTRIBUTION
- Law of demand. Provided by: Wikipedia. Located at: en.Wikipedia.org/wiki/Law_of_demand. License: CC BY-SA: Attribution-ShareAlike
- Giffen good. Provided by: Wiktionary. Located at: en.wiktionary.org/wiki/Giffen_good. License: CC BY-SA: Attribution-ShareAlike
- Veblen good. Provided by: Wiktionary. Located at: en.wiktionary.org/wiki/Veblen_good. License: CC BY-SA: Attribution-ShareAlike
- normal good. Provided by: Wiktionary. Located at: en.wiktionary.org/wiki/normal_good. License: CC BY-SA: Attribution-ShareAlike
- Law of demand. Provided by: Wikipedia. Located at: en.Wikipedia.org/wiki/Law_of_demand. License: Public Domain: No Known Copyright
- Demand curve. Provided by: Wikipedia. Located at: en.Wikipedia.org/wiki/Demand_curve. License: CC BY-SA: Attribution-ShareAlike
- Demand curve. Provided by: Wikipedia. Located at: en.Wikipedia.org/wiki/Demand_curve. License: CC BY-SA: Attribution-ShareAlike
- Market demand schedule. Provided by: Wikipedia. Located at: en.Wikipedia.org/wiki/Market_demand_schedule. License: CC BY-SA: Attribution-ShareAlike
- Demand Schedule. Provided by: econ100-powers-sectiona Wikispace. Located at: econ100-powers-sectiona.wikis...emand+Schedule. License: CC BY-SA: Attribution-ShareAlike
- Aggregate demand. Provided by: Wikipedia. Located at: en.Wikipedia.org/wiki/Aggregate_demand. License: CC BY-SA: Attribution-ShareAlike
- equilibrium. Provided by: Wiktionary. Located at: en.wiktionary.org/wiki/equilibrium. License: CC BY-SA: Attribution-ShareAlike
- Law of demand. Provided by: Wikipedia. Located at: en.Wikipedia.org/wiki/Law_of_demand. License: Public Domain: No Known Copyright
- Provided by: Wikimedia. Located at: upload.wikimedia.org/wikipedi...mand_curve.png. License: Public Domain: No Known Copyright
- Market demand schedule. Provided by: Wikipedia. Located at: en.Wikipedia.org/wiki/Market_demand_schedule. License: CC BY-SA: Attribution-ShareAlike
- Supply and demand. Provided by: Wikipedia. Located at: en.Wikipedia.org/wiki/Supply_and_demand. License: CC BY-SA: Attribution-ShareAlike
- Boundless. Provided by: Boundless Learning. Located at: www.boundless.com//economics/...3-eb0c9fca7500. License: CC BY-SA: Attribution-ShareAlike
- Law of demand. Provided by: Wikipedia. Located at: en.Wikipedia.org/wiki/Law_of_demand. License: Public Domain: No Known Copyright
- Provided by: Wikimedia. Located at: upload.wikimedia.org/wikipedi...mand_curve.png. License: Public Domain: No Known Copyright
- Provided by: Wikimedia. Located at: upload.wikimedia.org/wikipedi...edule_copy.png. License: CC BY-SA: Attribution-ShareAlike
- Provided by: Wikimedia. Located at: upload.wikimedia.org/wikipedi...demand.svg.png. License: CC BY-SA: Attribution-ShareAlike
- Ceteris paribus. Provided by: Wikipedia. Located at: en.Wikipedia.org/wiki/Ceteris_paribus. License: CC BY-SA: Attribution-ShareAlike
- ceteris paribus. Provided by: Wikipedia. Located at: en.Wikipedia.org/wiki/ceteris%20paribus. License: CC BY-SA: Attribution-ShareAlike
- Law of demand. Provided by: Wikipedia. Located at: en.Wikipedia.org/wiki/Law_of_demand. License: Public Domain: No Known Copyright
- Provided by: Wikimedia. Located at: upload.wikimedia.org/wikipedi...mand_curve.png. License: Public Domain: No Known Copyright
- Provided by: Wikimedia. Located at: upload.wikimedia.org/wikipedi...edule_copy.png. License: CC BY-SA: Attribution-ShareAlike
- Provided by: Wikimedia. Located at: upload.wikimedia.org/wikipedi...demand.svg.png. License: CC BY-SA: Attribution-ShareAlike
- Supply-and-demand. Provided by: Wikipedia. Located at: en.Wikipedia.org/wiki/File:Su...and-demand.svg. License: CC BY-SA: Attribution-ShareAlike
- Demand curve. Provided by: Wikipedia. Located at: en.Wikipedia.org/wiki/Demand_curve. License: CC BY-SA: Attribution-ShareAlike
- Demand curve. Provided by: Wikipedia. Located at: en.Wikipedia.org/wiki/Demand_curve. License: CC BY-SA: Attribution-ShareAlike
- Demand curve. Provided by: Wikipedia. Located at: en.Wikipedia.org/wiki/Demand_curve. License: CC BY-SA: Attribution-ShareAlike
- inferior good. Provided by: Wiktionary. Located at: en.wiktionary.org/wiki/inferior_good. License: CC BY-SA: Attribution-ShareAlike
- normal good. Provided by: Wiktionary. Located at: en.wiktionary.org/wiki/normal_good. License: CC BY-SA: Attribution-ShareAlike
- Law of demand. Provided by: Wikipedia. Located at: http://en.Wikipedia.org/wiki/Law_of_demand. License: Public Domain: No Known Copyright
- Provided by: Wikimedia. Located at: upload.wikimedia.org/wikipedi...mand_curve.png. License: Public Domain: No Known Copyright
- Provided by: Wikimedia. Located at: upload.wikimedia.org/wikipedi...edule_copy.png. License: CC BY-SA: Attribution-ShareAlike
- Provided by: Wikimedia. Located at: upload.wikimedia.org/wikipedi...demand.svg.png. License: CC BY-SA: Attribution-ShareAlike
- Supply-and-demand. Provided by: Wikipedia. Located at: en.Wikipedia.org/wiki/File:Su...and-demand.svg. License: CC BY-SA: Attribution-ShareAlike
- Supply-and-demand. Provided by: Wikipedia. Located at: en.Wikipedia.org/wiki/File:Su...and-demand.svg. License: CC BY-SA: Attribution-ShareAlike


